Industry Economics & Competitiveness
Track how each country ranks in commodity manufacturing competitiveness across industries — and what drives its position month after month.
Watch Video
Country Rankings by Industry
See how a country ranks, industry by industry, to inform your strategic planning.
Monthly Reports, Fresh Decisions
Updated every month, the reports help you track changing costs, risks, and competitiveness.
What Drives Each Ranking
See the cost, market, infrastructure, and policy forces behind each country’s competitiveness.
33 Country Reports
Each report focuses on one country, making industrial economics easier to read and compare.
About this Solution
Industry Economics & Competitiveness ranks each covered country on its competitiveness for commodity manufacturing — and helps explain what is pushing every ranking up or down.
Each report focuses on one country and examines how it ranks across major commodity industries. It shows where the country performs better or worse, then breaks down the main forces behind each ranking — from labor, energy, logistics, and capital costs to taxes, market size, trade, and industrial production.
The result is a country-level report that gives readers a clear competitiveness picture and a full view of the forces shaping it.
Explore Full Sample Report


33 Country Reports, One Consistent Framework
Reports are released monthly, with each edition focused on a single country and built on the same framework.
Select a country on the map
Industry Economics & Competitiveness in this country
May 2026 · Advanced Edition
Monthly report on this country's competitiveness across the major commodity industries, with a breakdown of the cost, market, and structural forces shaping each ranking.
What Every Report Covers
Industries frame the analysis, pillars drive each ranking, and reference datasets extend the picture with practical inputs.
Inside the Pillars of Competitiveness
Behind every ranking sits a set of pillars — the structural and economic forces that determine a country's competitiveness.
Manufacturing Labor Costs
The true cost of an hour of manufacturing labor — wages plus benefits and taxes, adjusted by workforce productivity.
Construction Labor Costs
The same hourly-cost view, applied to construction and installation workers.
Capital & Construction Costs
How competitive the country is for building industrial plants, based on relative construction cost factors for materials, labor, taxes, freight, and local execution conditions.
Energy & Utilities Costs
What industrial users pay for energy and process utilities in the country — an average industrial energy price, plus individual costs for steam, water, and process and atmospheric gases.
Logistics & Infrastructure
How well the country moves goods and supports manufacturing — ports, roads, rail, utility infrastructure, and investment.
Freight Costs
What it costs to move freight in and out of the country — maritime and inland, import and export.
Macroeconomic Environment
The financial climate manufacturers operate in — currency stability, inflation, and interest rates.
Domestic Tax Environment
The tax burden on manufacturing operations — corporate income tax and indirect taxes.
Commodity Prices
Local USD prices for industrial commodities across all seven industries — lower prices mean a stronger cost position.
Feedstock-to-Product Margins
The spread between product prices and feedstock costs — the operating margin environment, industry by industry.
Industrial Production
How much each industry actually manufactures in the country, benchmarked against the program.
Global Trade Integration
Exports, imports, trade openness, and trade-partner diversification.
Tariff Protection & Market Access
The tariff rates each industry faces, on imports into the country and on exports abroad.
Domestic Market Size
How big the domestic market is for each industry's products.
Reference Datasets
Give analysts a consistent data layer to keep feasibility studies, cost comparisons, and investment decisions anchored in current market conditions.
Industrial Utility Costs
Plant Construction Indexes & Location Factors
Update a past plant cost to today's value — or to what it would be in another country.
Learn More
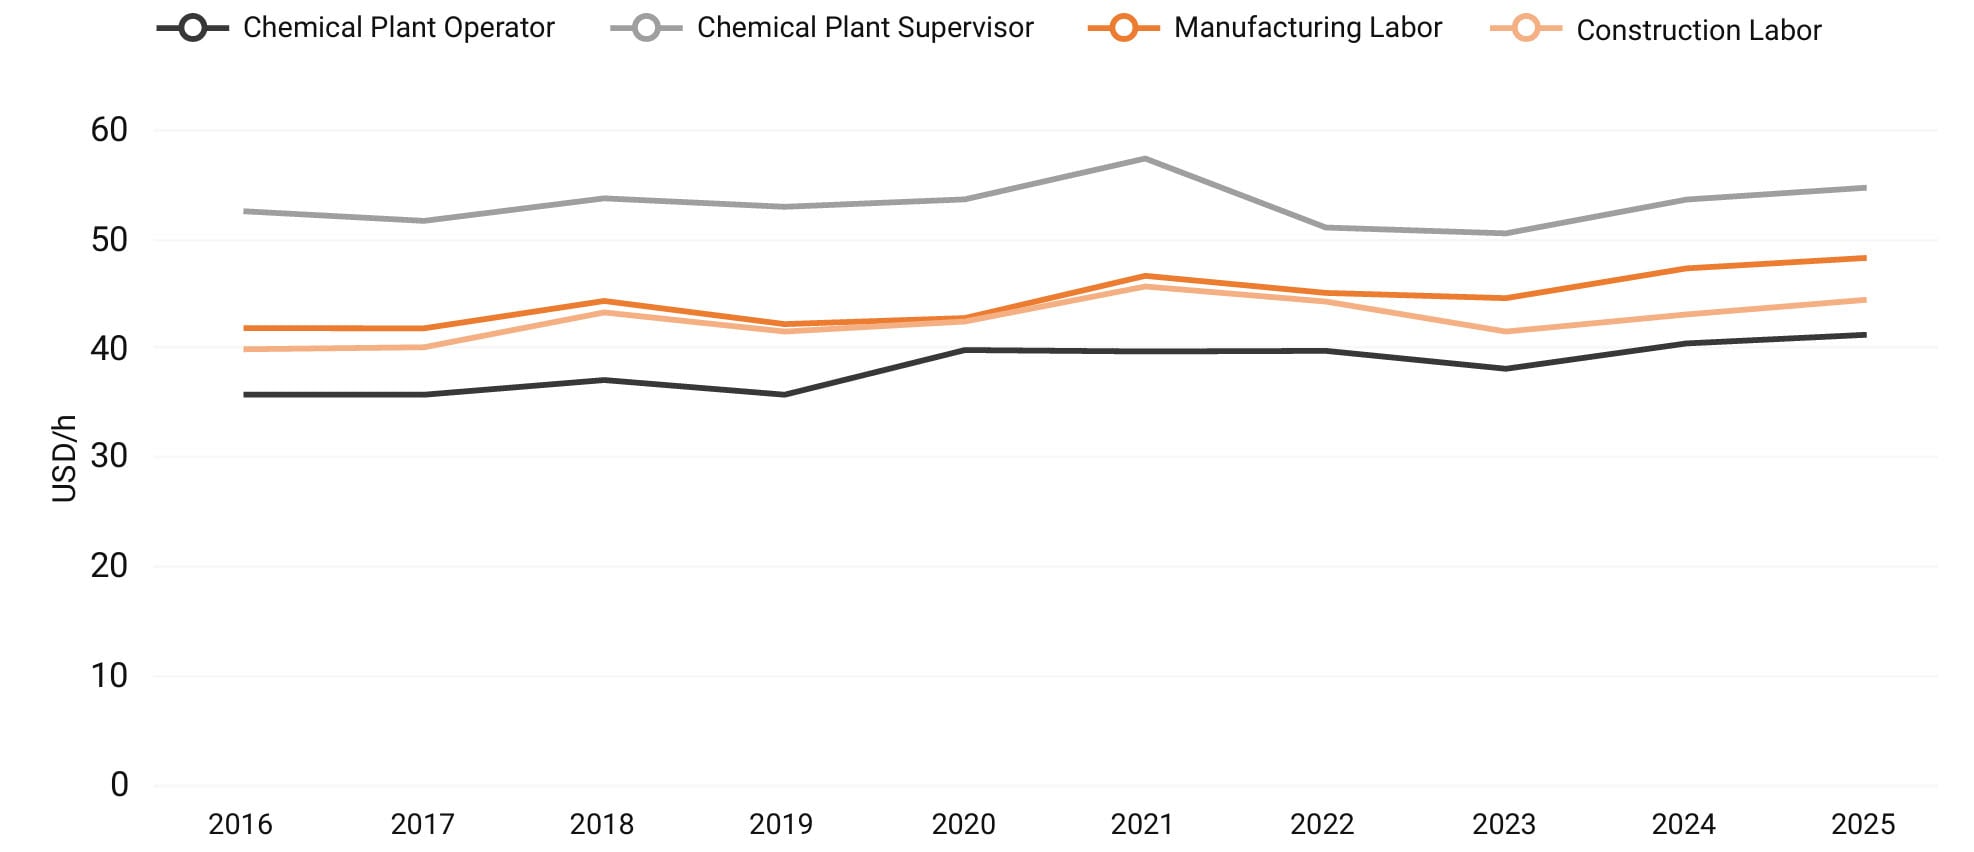
Labor Costs & Productivity Factors
See the true employer cost of a worker in the report's country.
Learn MoreWhy Choose Industry Economics & Competitiveness
See how country competitiveness translates into investment, sourcing, and manufacturing strategy.
Screen Locations Before Deeper Studies
Identify countries that deserve closer evaluation before investing time and budget in detailed feasibility work.
Find Structural Cost Advantages
See which factors give a country an edge — from labor, energy, logistics, and capital costs to market size and trade conditions.
Diagnose Competitiveness Gaps
Identify the cost, market, infrastructure, or policy factors that weaken a country's position in commodity manufacturing.
Review Sourcing Country Exposure
Assess whether key sourcing countries face stronger cost pressure, weaker competitiveness, or structural disadvantages over time.
Strengthen Feasibility and Budget Studies
Use competitiveness indicators and reference datasets — including utility and labor cost data — to support feasibility studies and cost estimates.
Guide Deeper Country Analysis
Use rankings and pillar breakdowns to decide where country, industry, or cost assumptions should be examined more closely.
Delivery Methods
Methodology
Every report is built on a structured methodology that pulls inputs from many sources — different units, different timelines — into a single comparison framework, turning raw data into directly comparable scores and rankings.
The same framework runs across all 33 countries, every month — so numbers compare directly, country against country, month against month.