Industry Economics & Competitiveness
Contents in Detail
A section-by-section view of what each monthly country report covers — and how the content expands across editions.
Every month, the Industry Economics & Competitiveness country report walks you through what makes a country competitive — and what holds it back. It moves from the country's economic profile to industry-wide operating conditions, then to the economics of each industrial sector, closing with overall scores and historical data. Here's what each edition includes, chapter by chapter.









Executive Summary
A one-page snapshot showing the country's overall ranking among the 33 countries in the program, its best- and worst-ranked industrial sectors, and the largest year-over-year movements.
Country Basic Indicators
Reference figures for the country — Gross Domestic Product and GDP per capita, population, industrial composition, manufacturing workforce, and transport infrastructure indicators.
Manufacturing Labor Costs - Country Performance
The total hourly cost employers pay for a manufacturing worker in this country — adjusted for productivity — with global rank and changes from last month and a year ago.
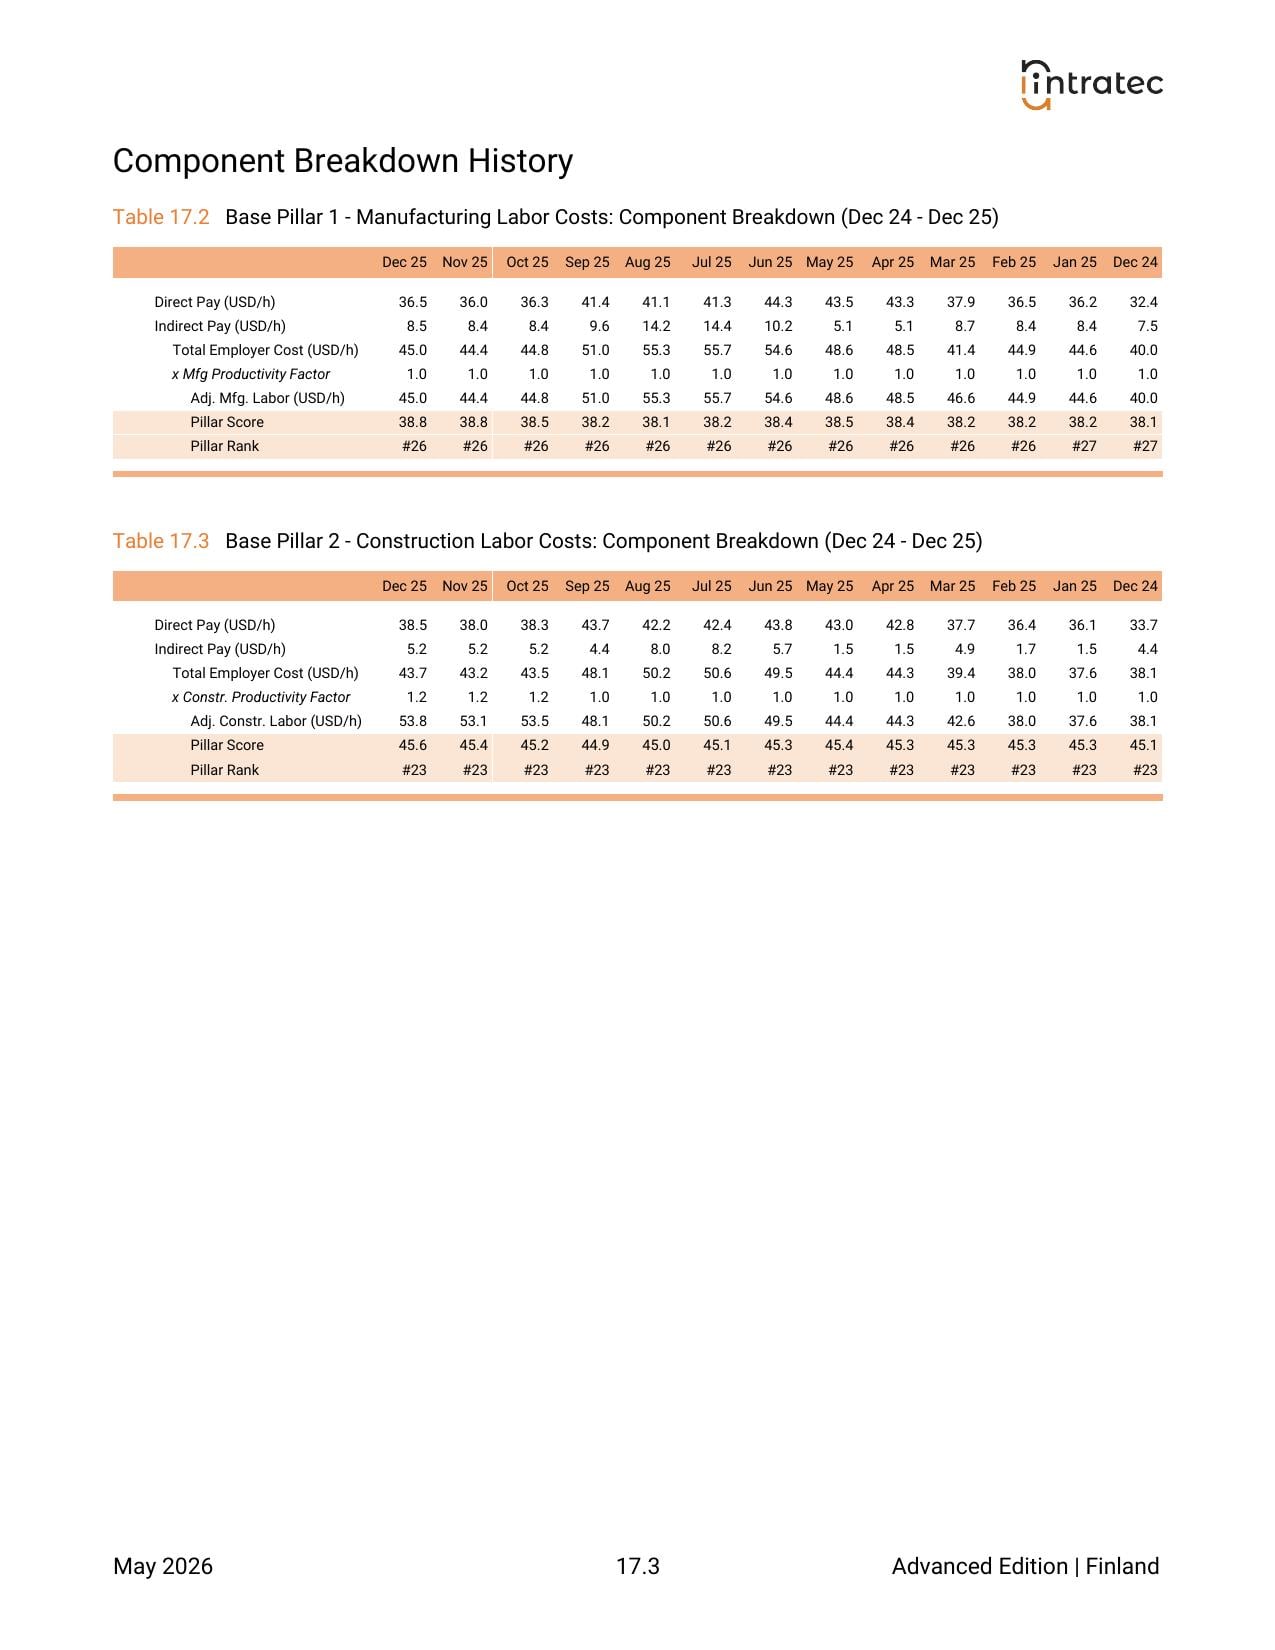
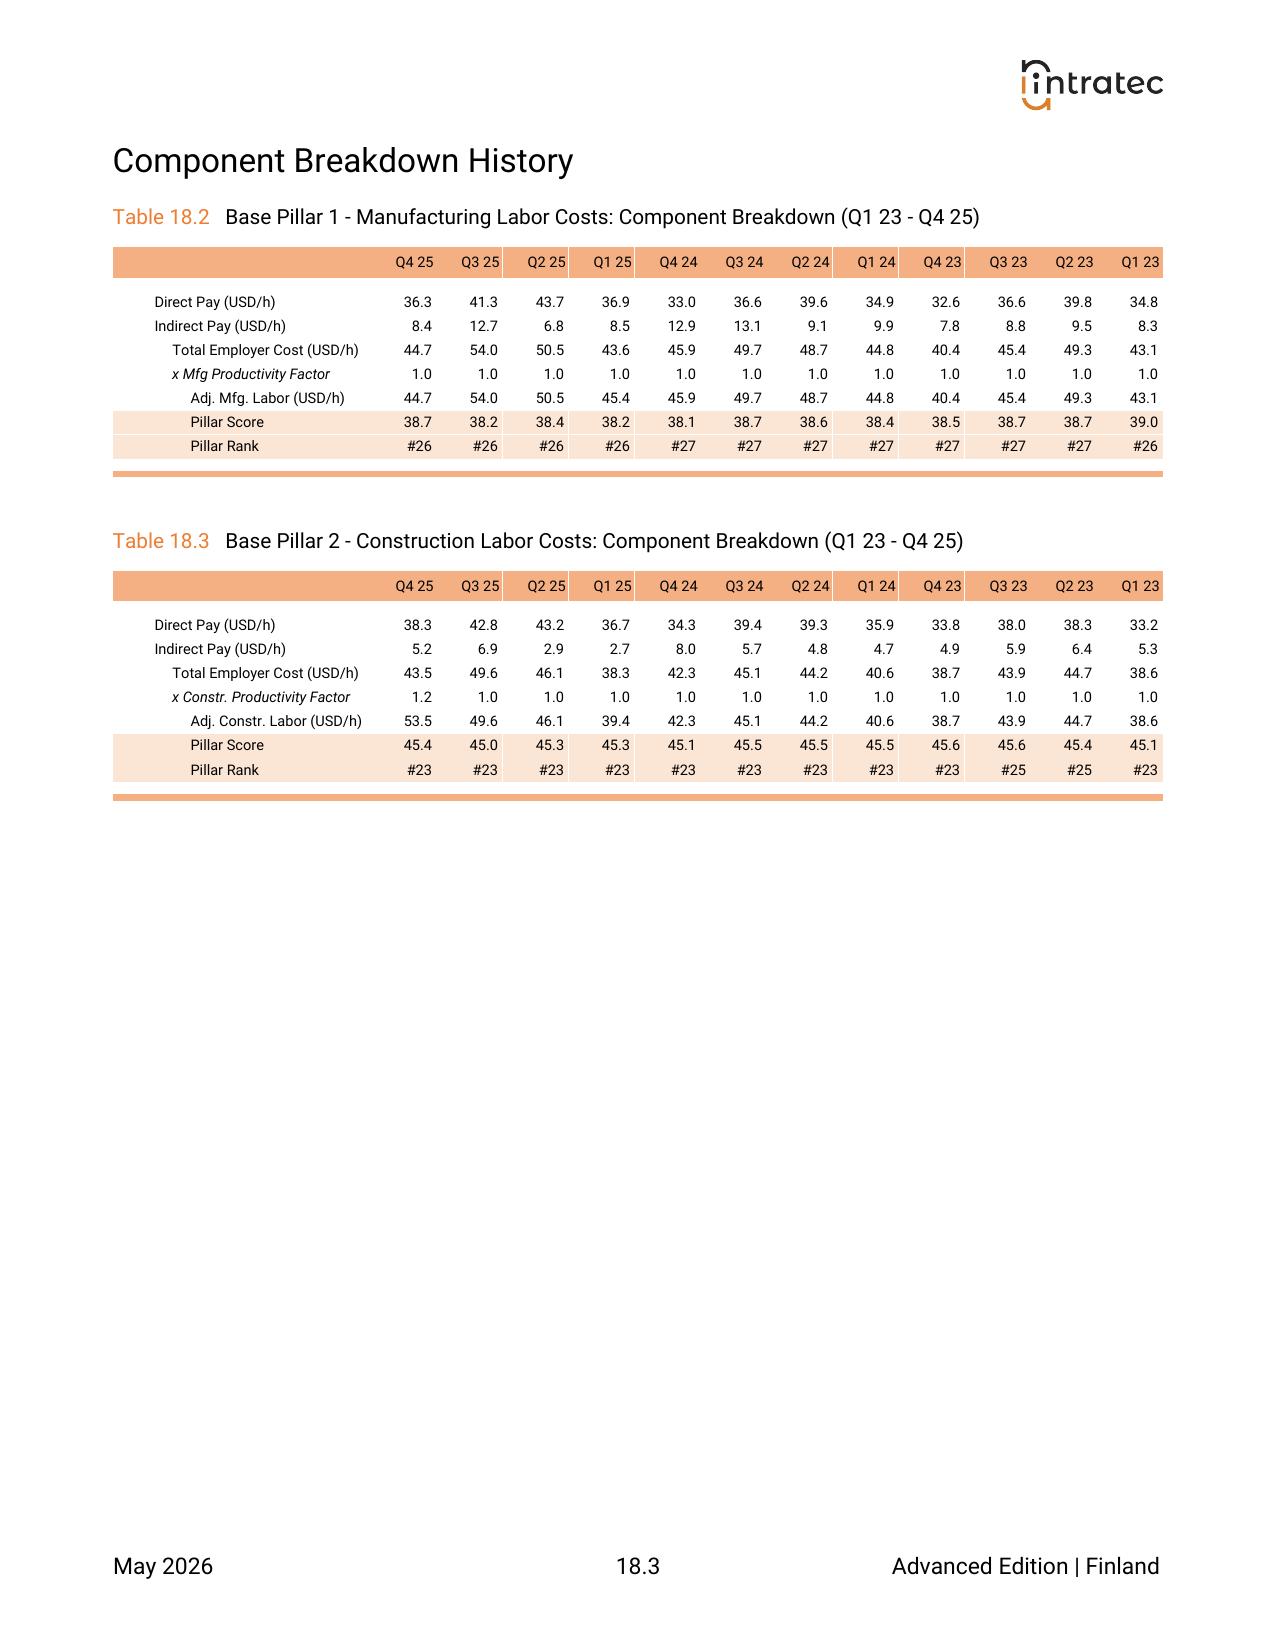
Manufacturing Labor Costs - Pillar Breakdown
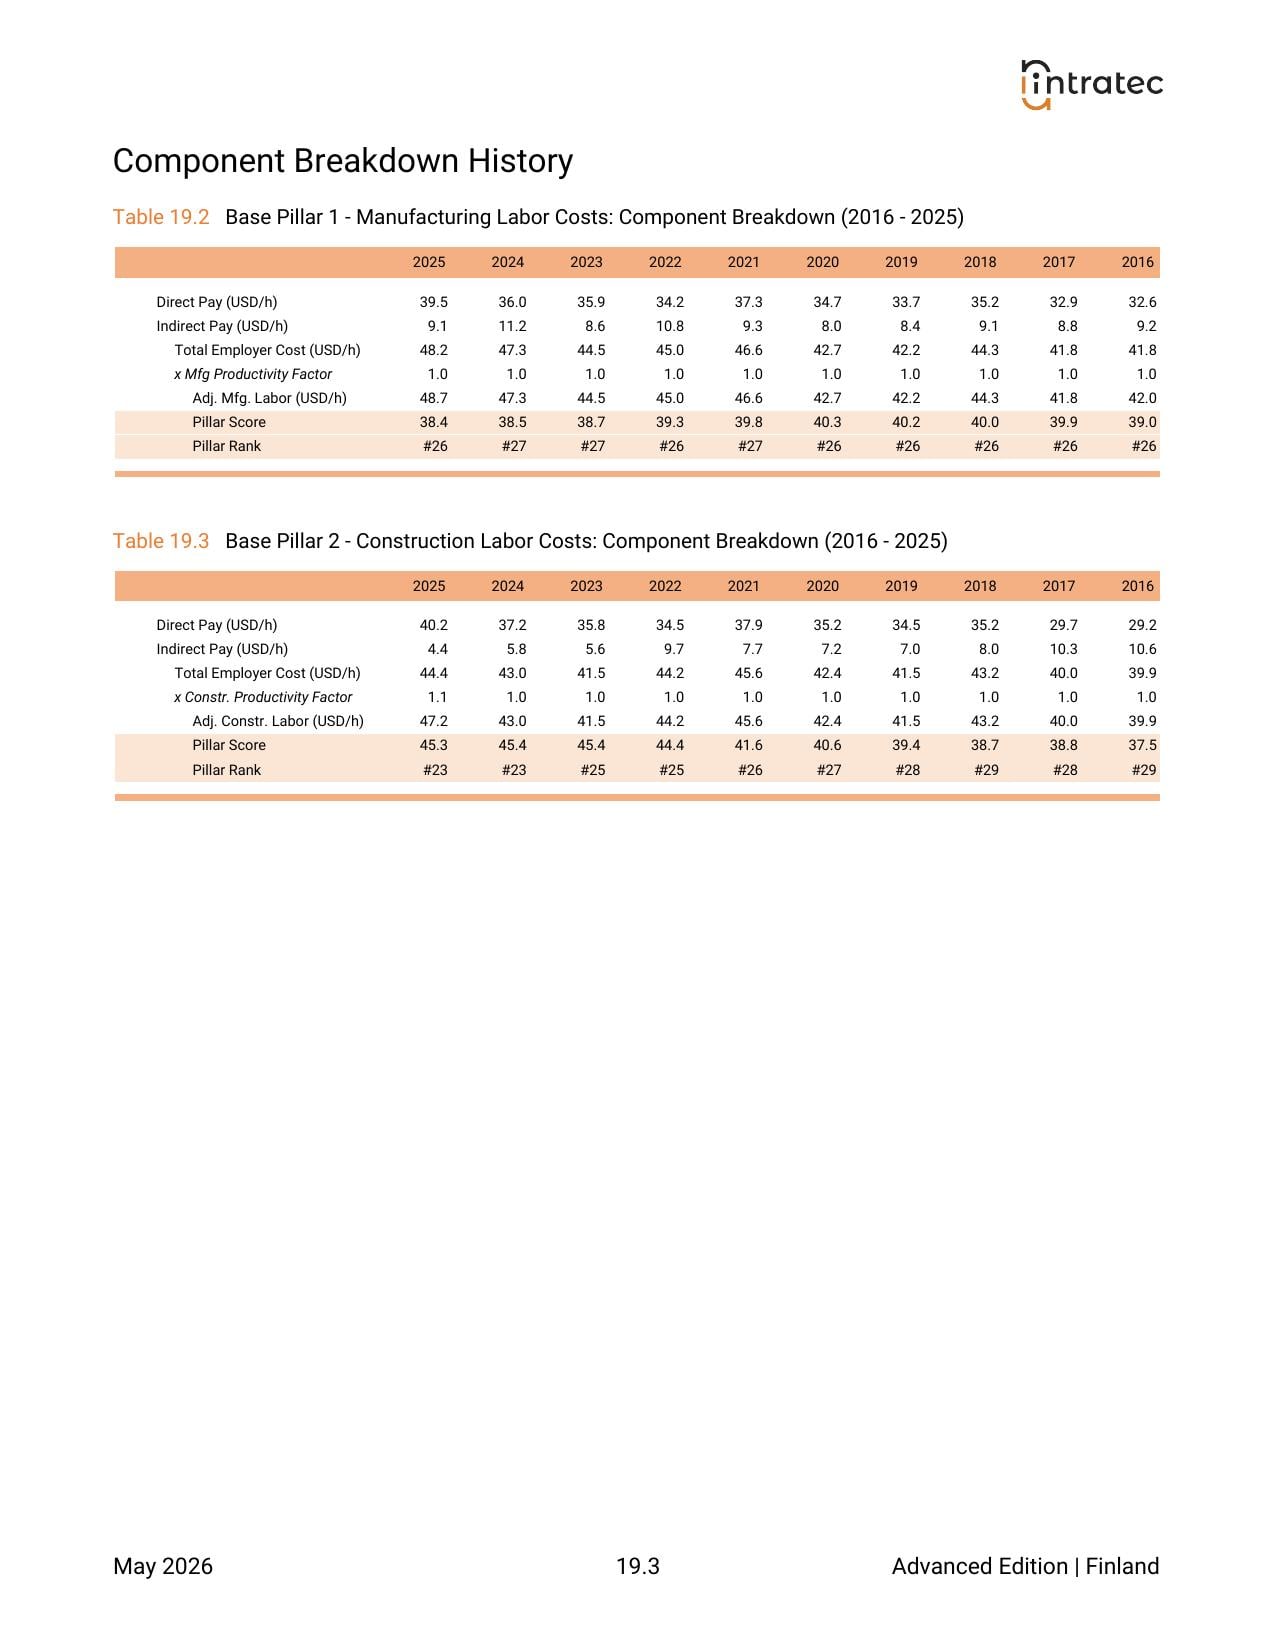
The cost components that build up the manufacturing-labor hourly figure — wages, mandatory benefits, payroll taxes, voluntary benefits — plus the productivity factor applied to reach the adjusted total.
Construction Labor Costs - Country Performance
The total hourly cost employers pay for a construction worker in this country — adjusted for productivity — with global rank and changes from last month and a year ago.
Construction Labor Costs - Pillar Breakdown
The cost components that build up the construction-labor hourly figure — wages, mandatory benefits, payroll taxes, voluntary benefits — plus the productivity factor applied to reach the adjusted total.
Capital & Construction Costs - Country Performance
A relative construction-cost factor showing how much it costs to build an industrial plant in this country compared with the same plant in the USA (USA = 1.00), with global rank and changes from last month and a year ago.
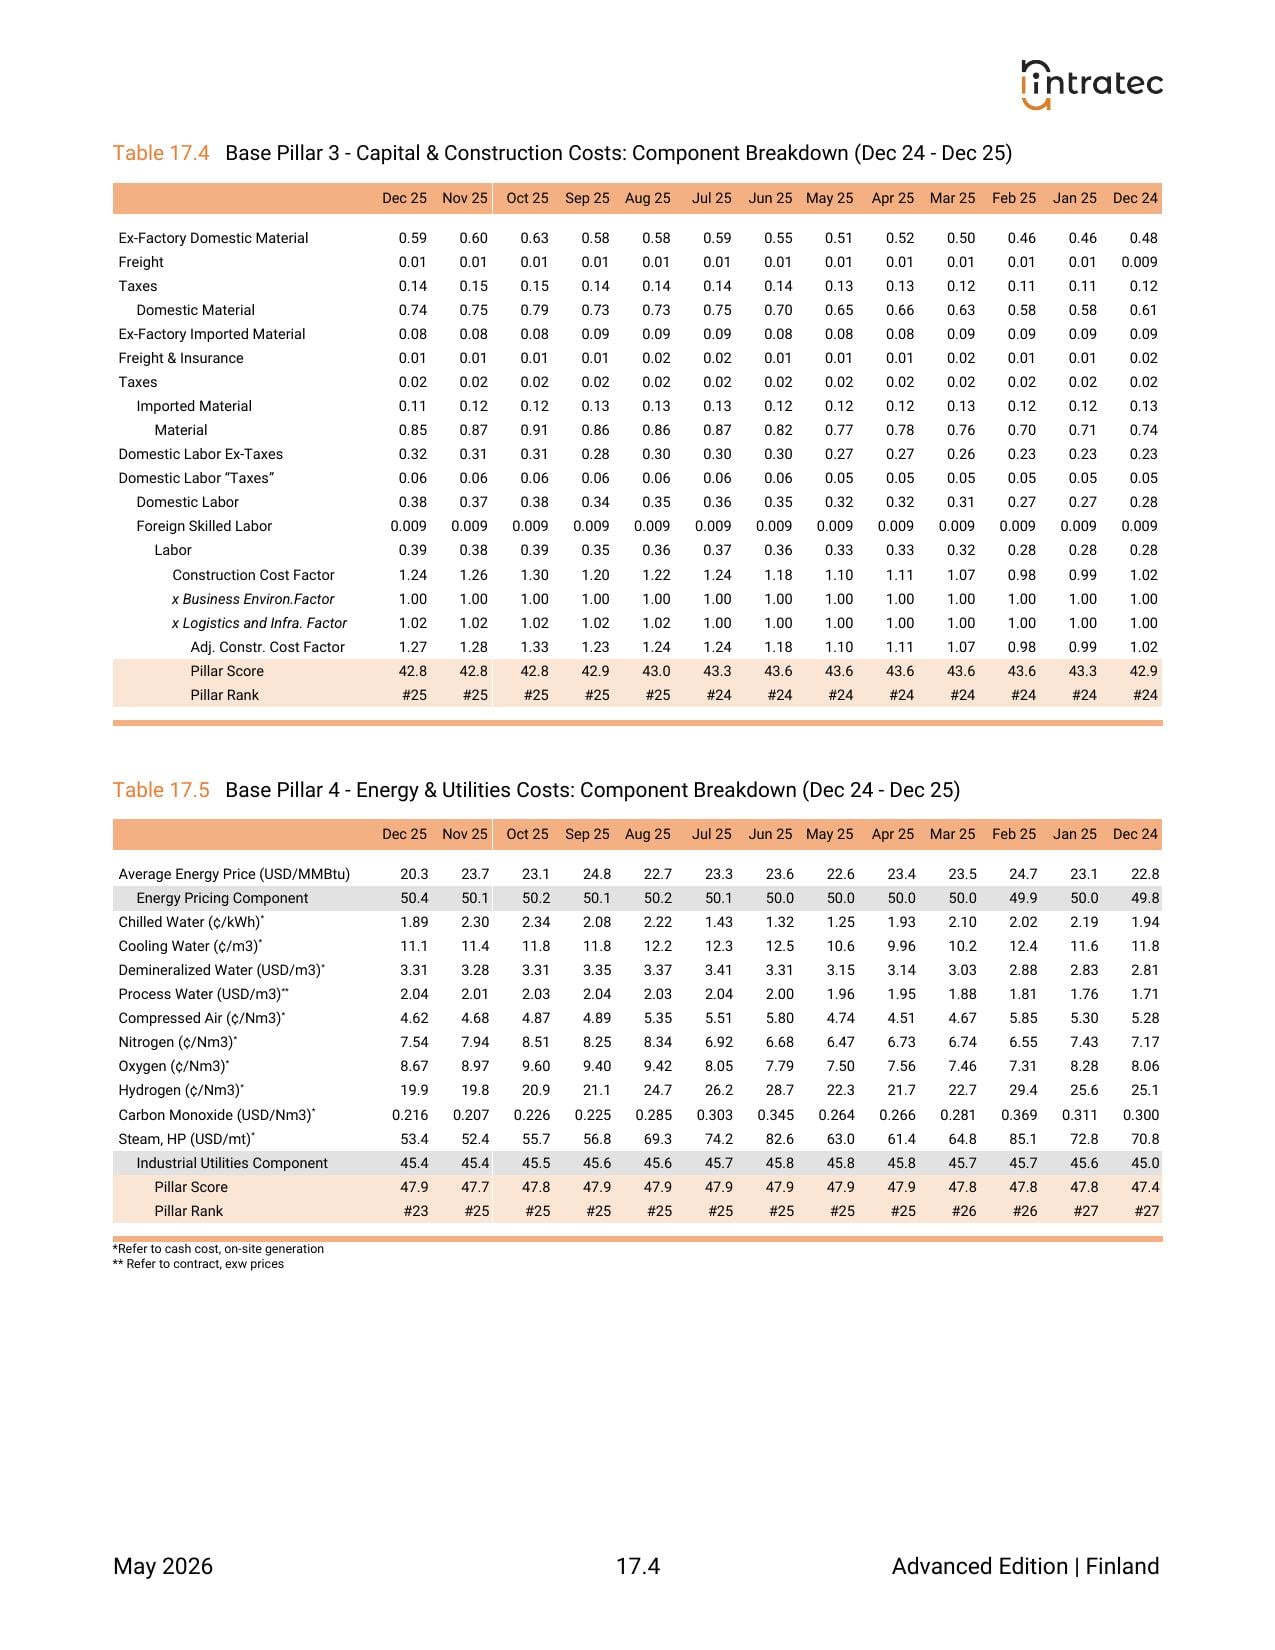
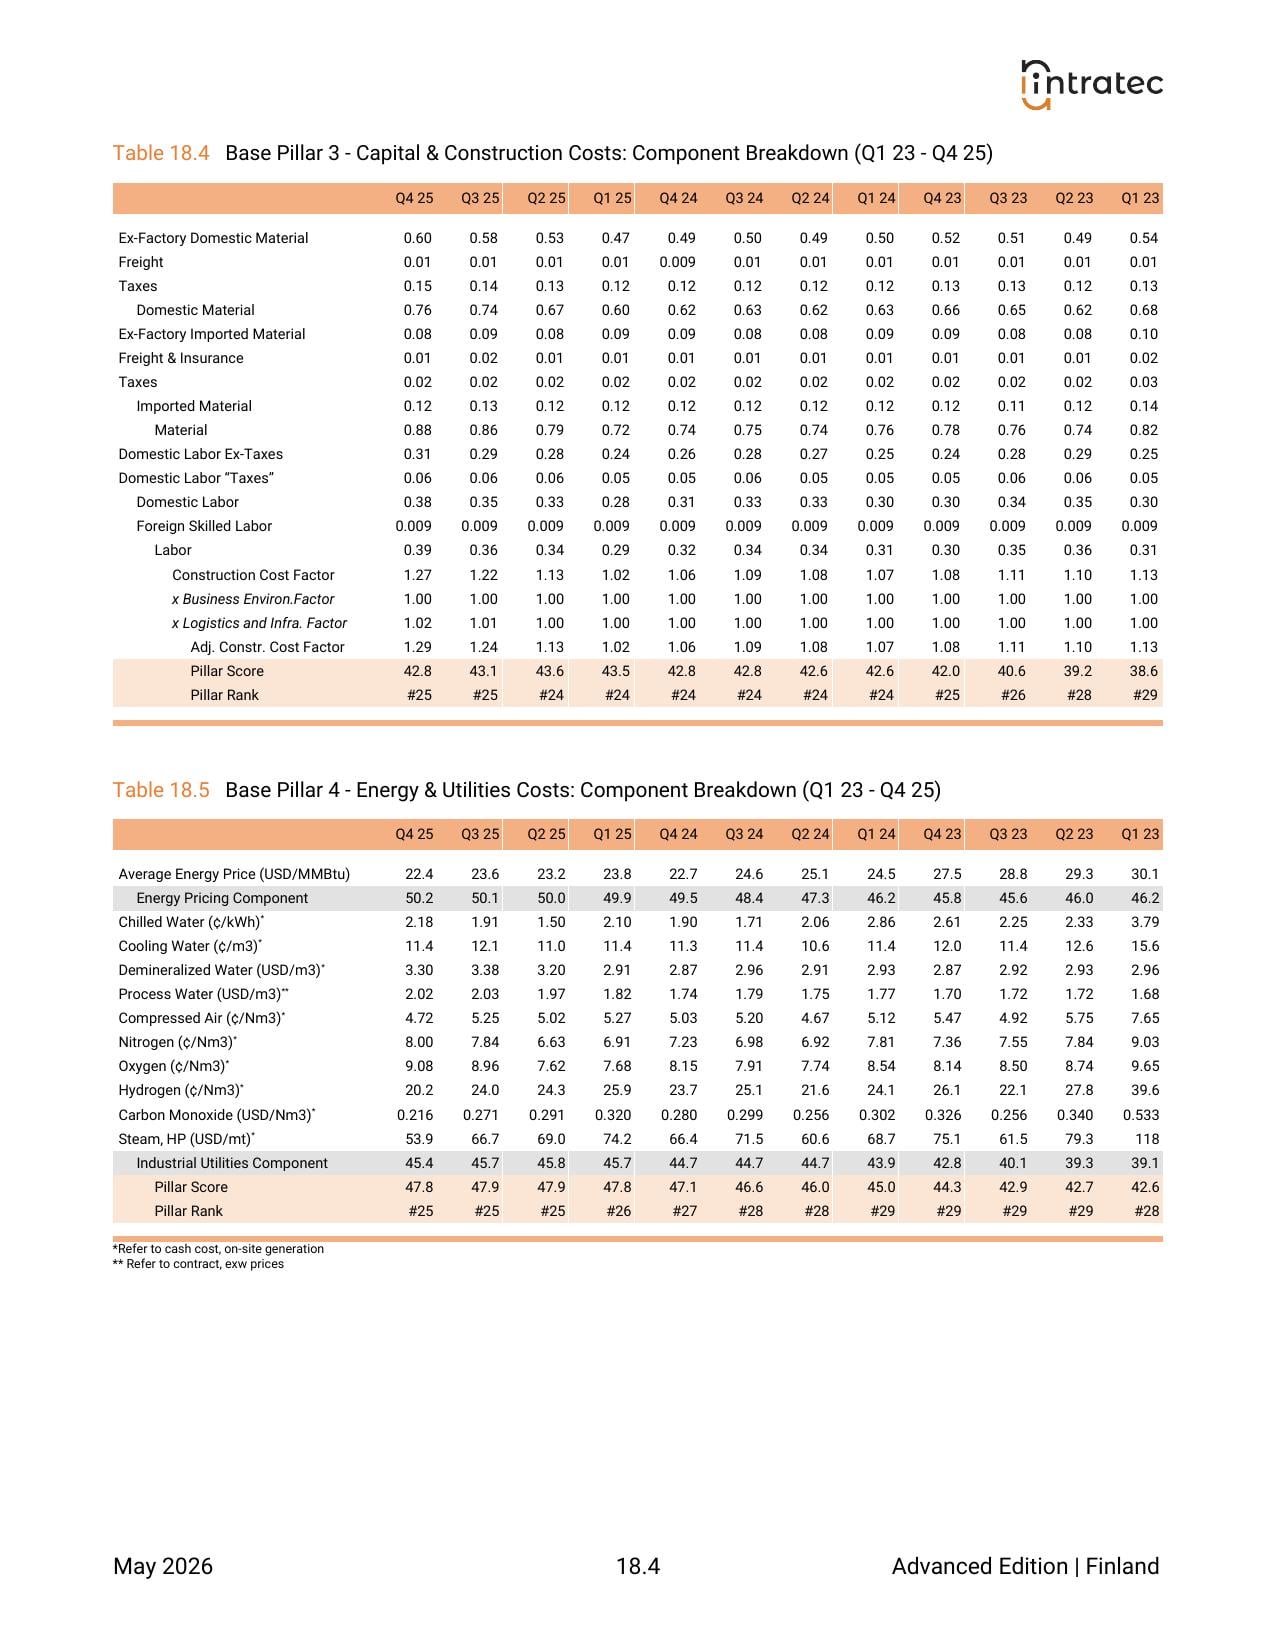
Capital & Construction Costs - Pillar Breakdown
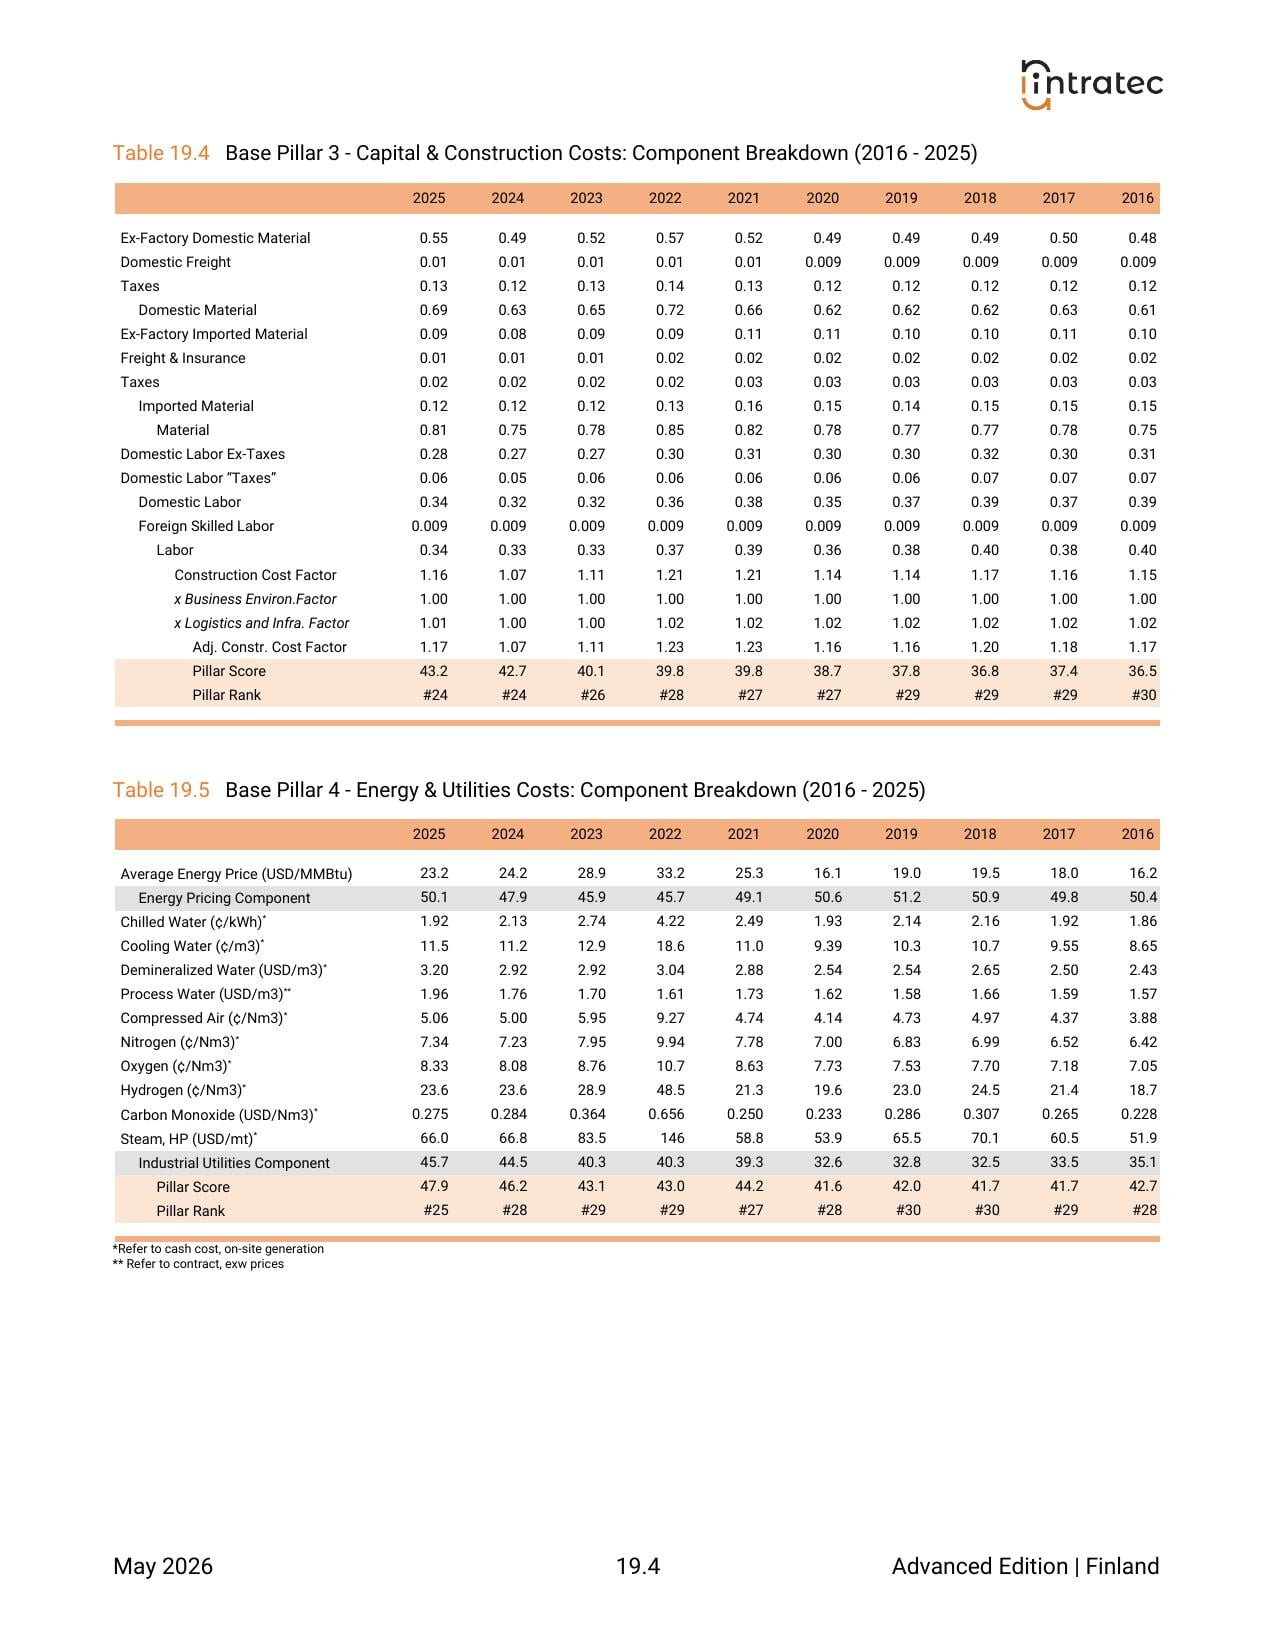
The components behind the construction-cost factor — domestic and imported materials, skilled labor, taxes, freight — and how the balance between material and labor costs has shifted over the past 12 months.
Energy & Utilities Costs - Country Performance
How the country ranks globally on energy and industrial-utility affordability, the average industrial energy price, and the change from last month and a year ago.
Energy & Utilities Costs - Pillar Breakdown
Separate views of energy pricing and industrial utilities, with unit costs for 10 individual utilities (steam, process and atmospheric gases, water services) and the trend in average industrial energy prices over the past 12 months.
Logistics & Infrastructure - Country Performance
How the country ranks globally on logistics and infrastructure capacity — roads, ports, utilities, and the systems that move goods in and out — with changes from last month and a year ago.
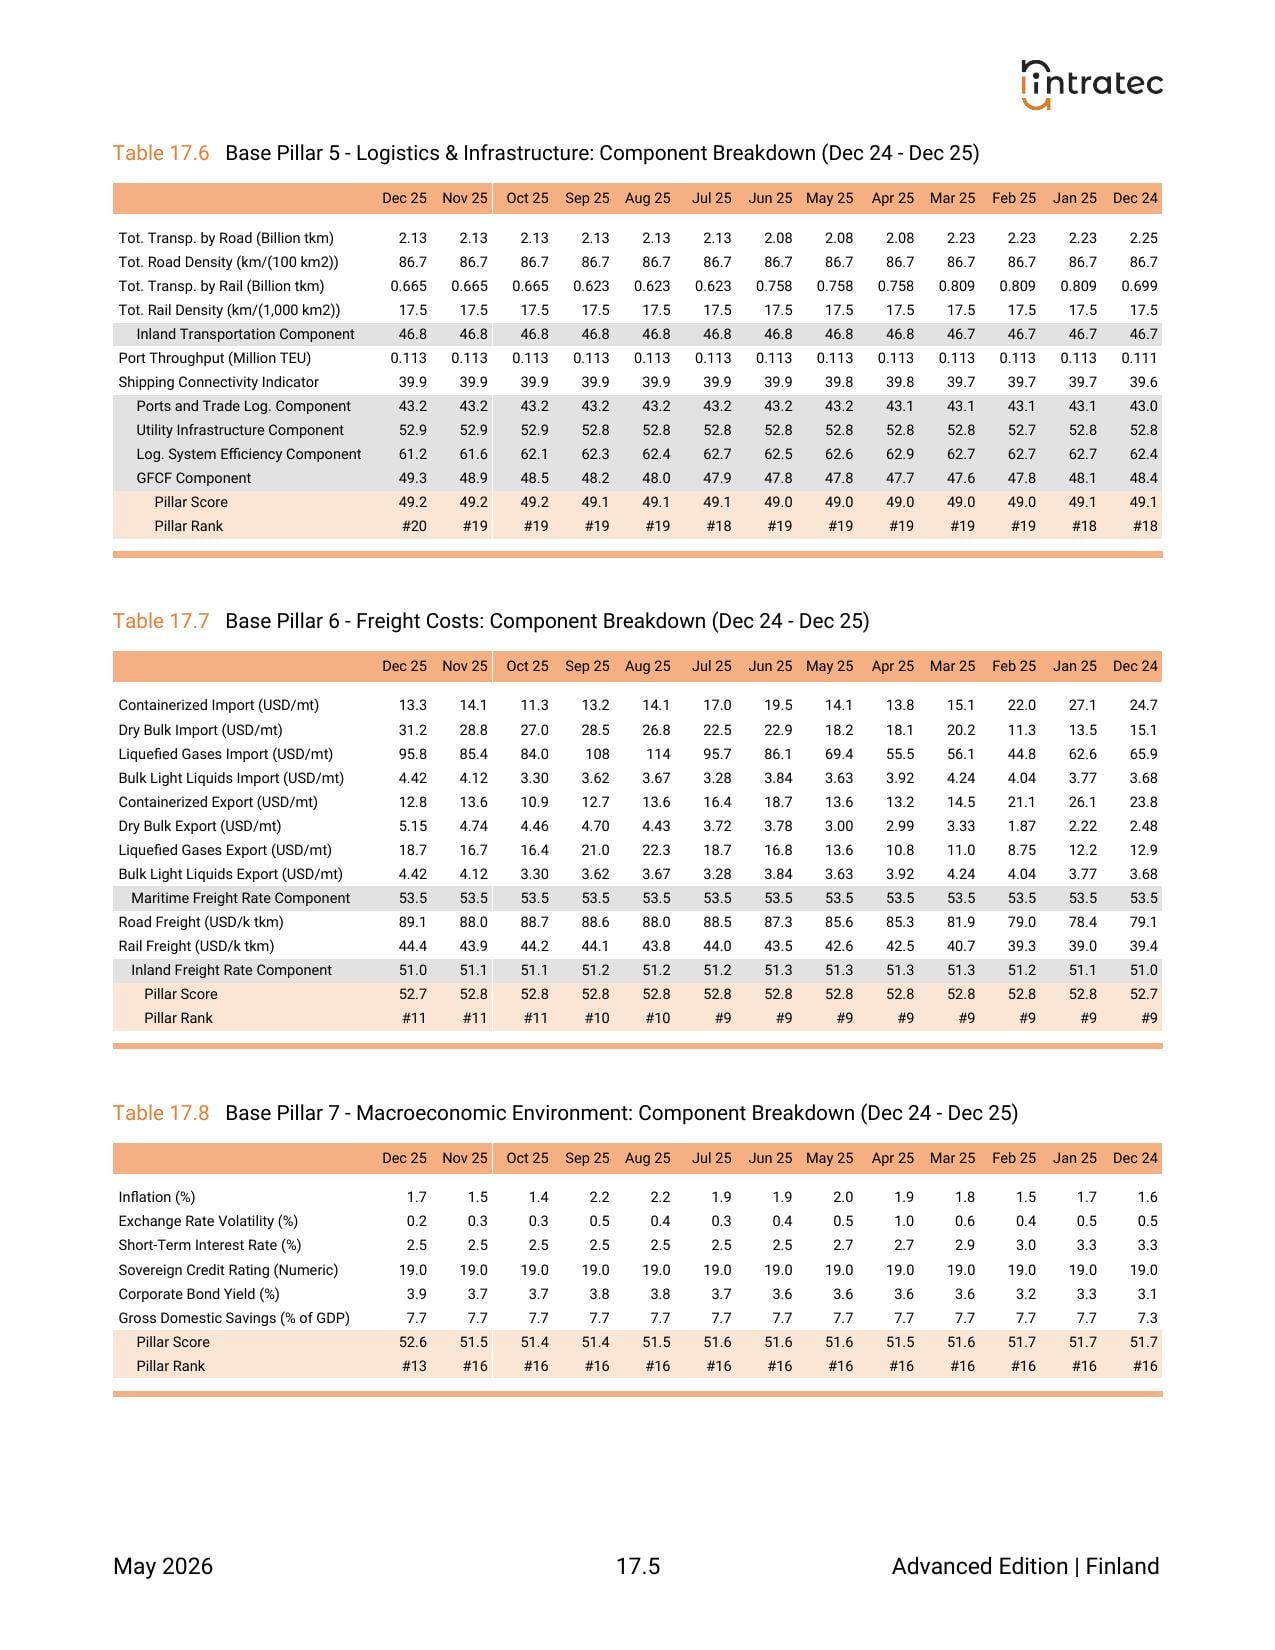
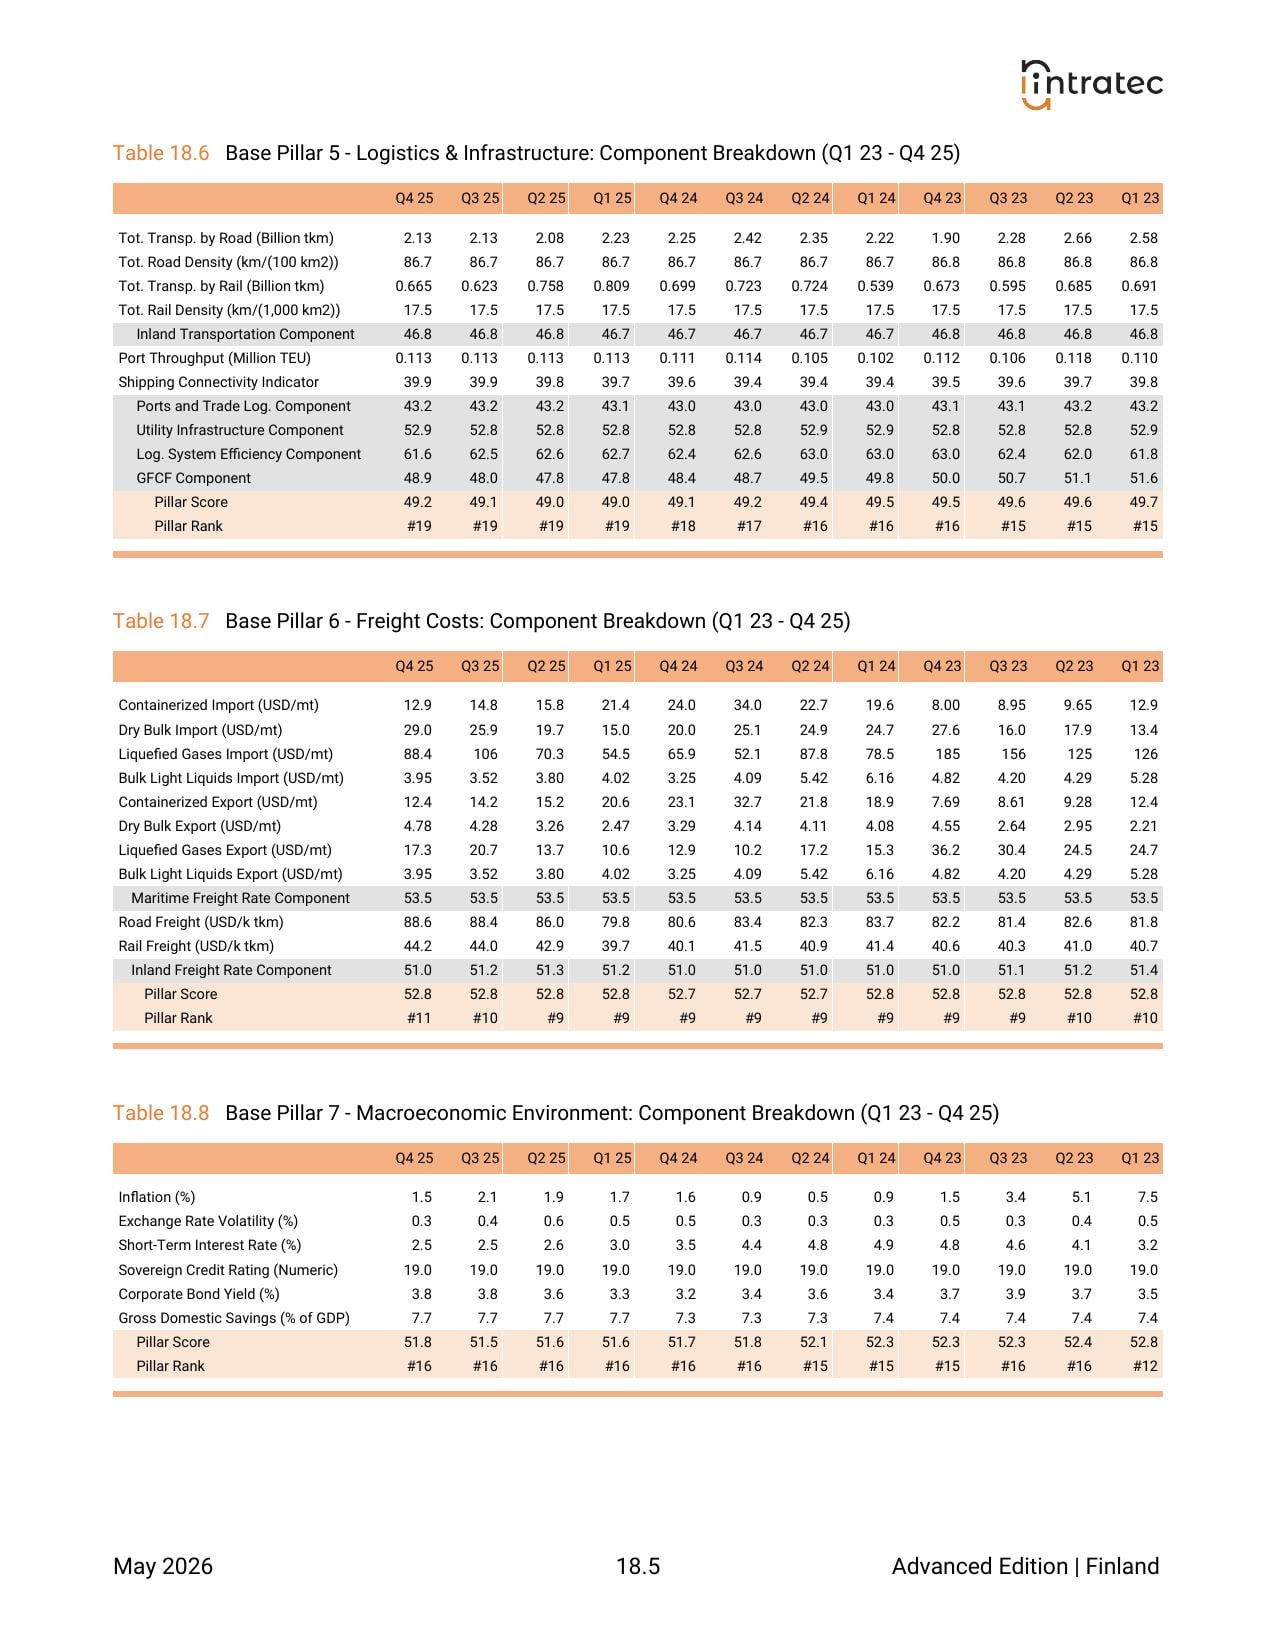
Logistics & Infrastructure - Pillar Breakdown
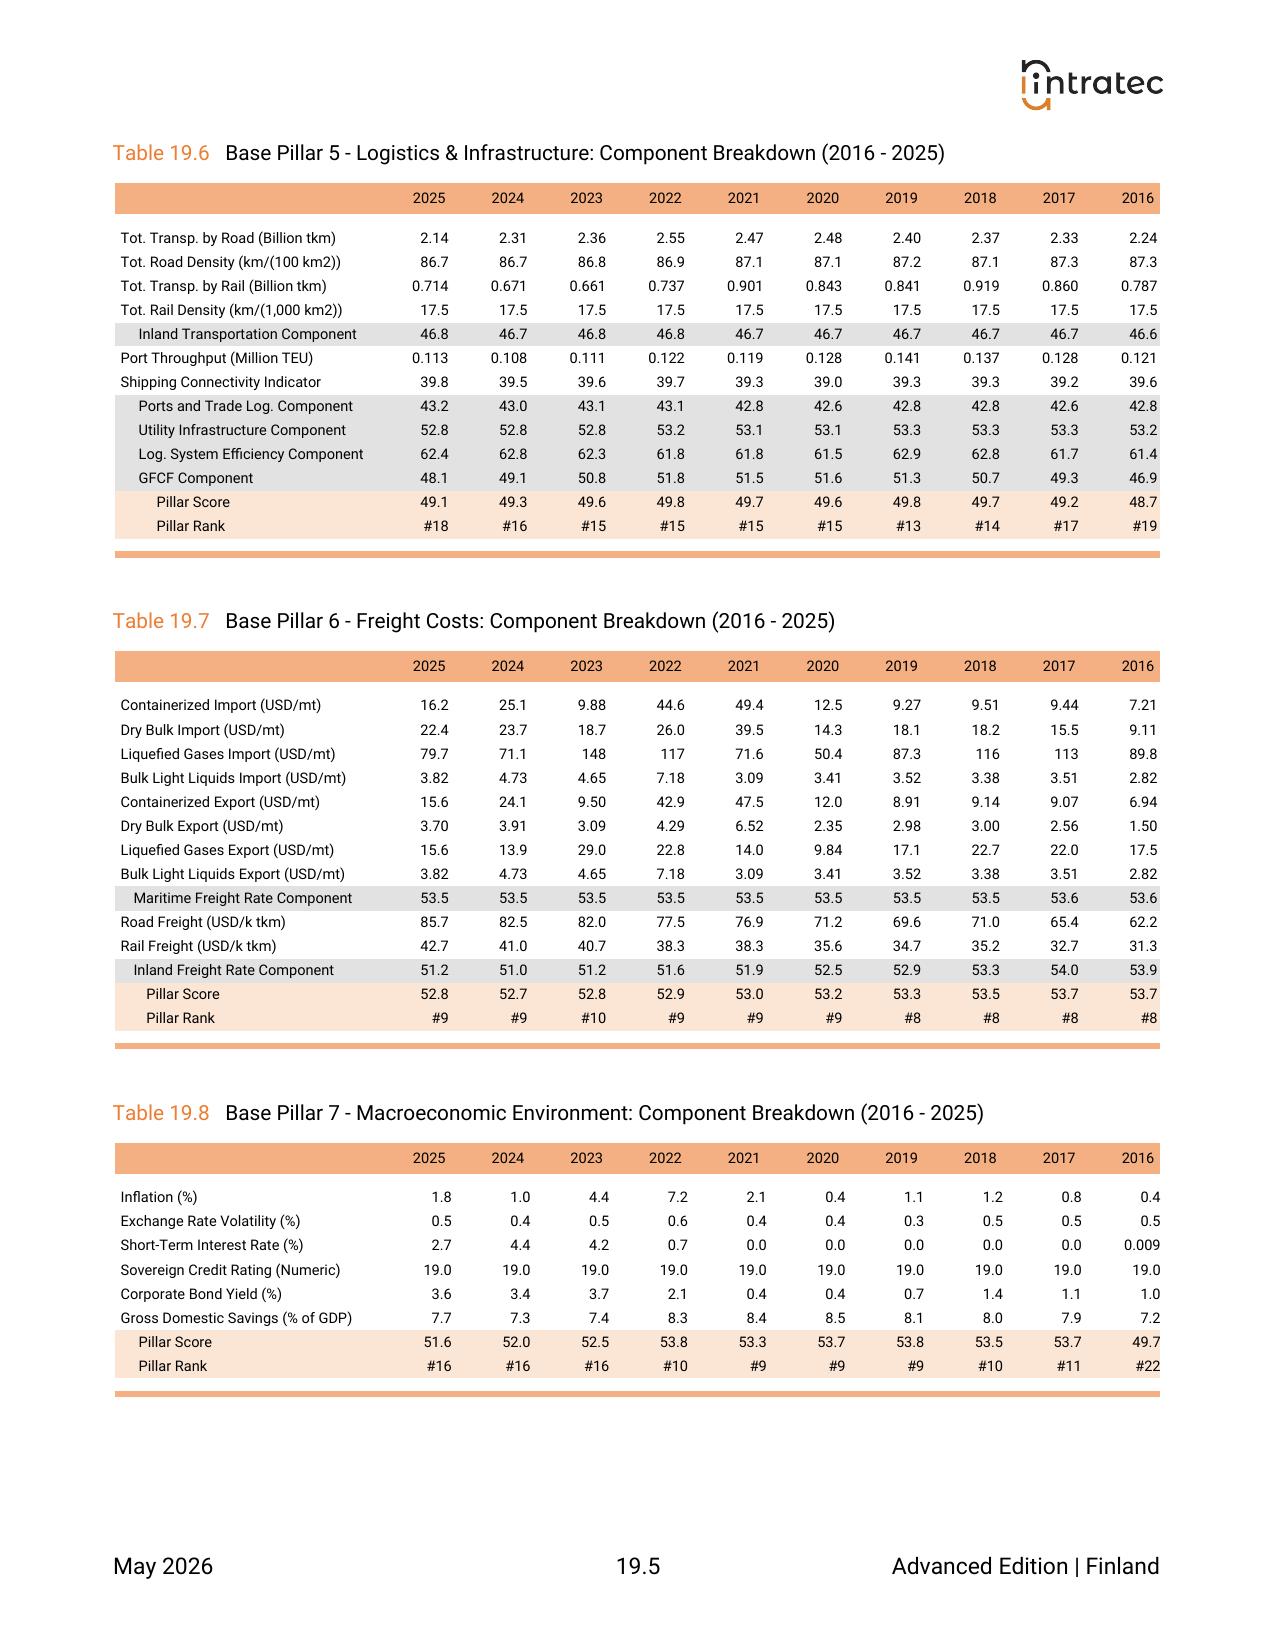
Individual indicators for the 5 dimensions of logistics and infrastructure — inland transport, ports and trade logistics, overall logistics performance, utility infrastructure, infrastructure investment — with peer-country comparisons and trends over the past 12 months.
Freight Costs - Country Performance
Freight rates for moving goods to, from, and within this country — maritime rates across 4 cargo categories and inland rates for road and rail — with global rank and changes from last month and a year ago.
Freight Costs - Pillar Breakdown
A breakdown of freight rates by mode (maritime versus inland), the gap between import and export rates by cargo category, and how road and rail unit costs stack up against peer countries.
Macroeconomic Environment - Country Performance
Six headline indicators of the financial environment manufacturers face — inflation rate, currency volatility, short-term interest rate, sovereign credit rating, corporate bond yield, gross national savings — with rank and changes from last month and a year ago.
Macroeconomic Environment - Pillar Breakdown
Each of the 6 macroeconomic indicators benchmarked against peer countries, a side-by-side view of inflation and currency stability, and how bond yields, interest rates, and inflation have moved over the past 12 months.
Domestic Tax Environment - Country Performance
The main tax rates that fall on industrial operations — corporate income tax, indirect taxes, payroll burdens, machinery import duties — with rank and changes from last month and a year ago.
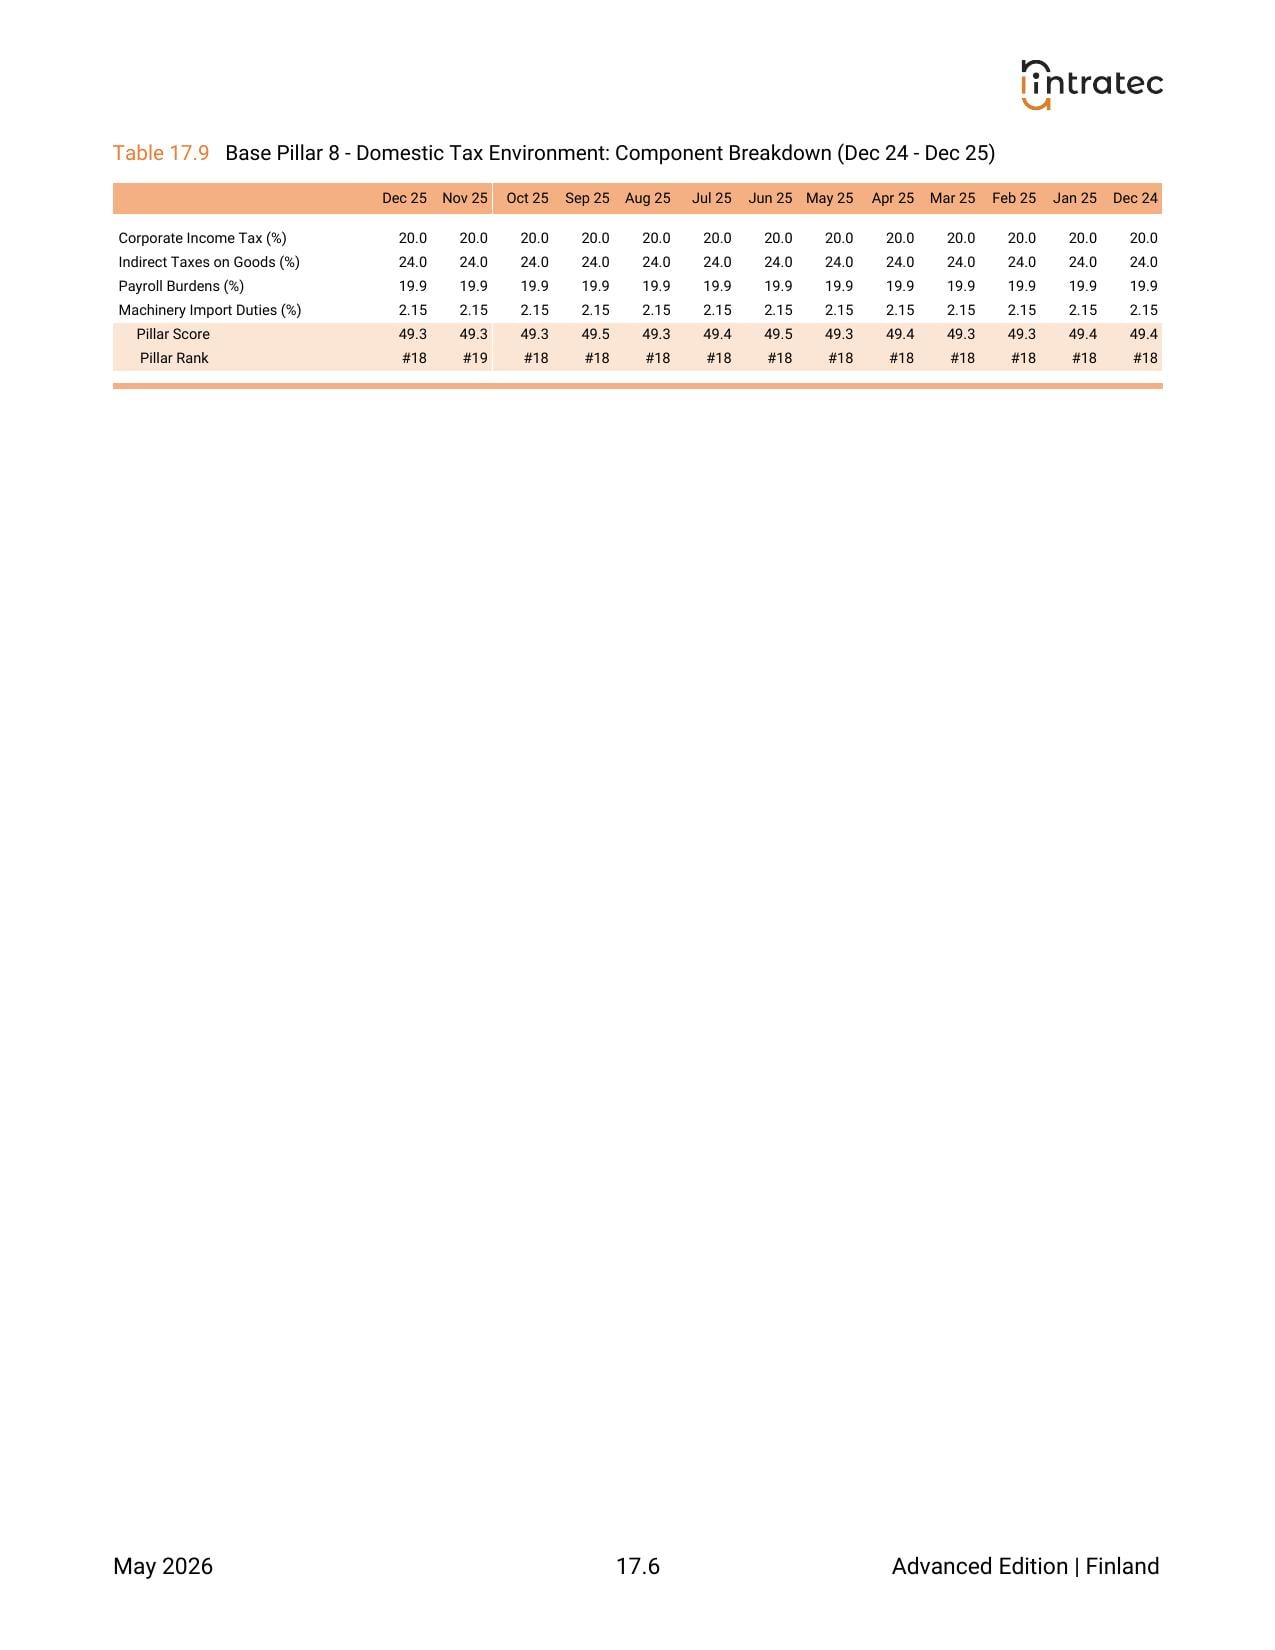
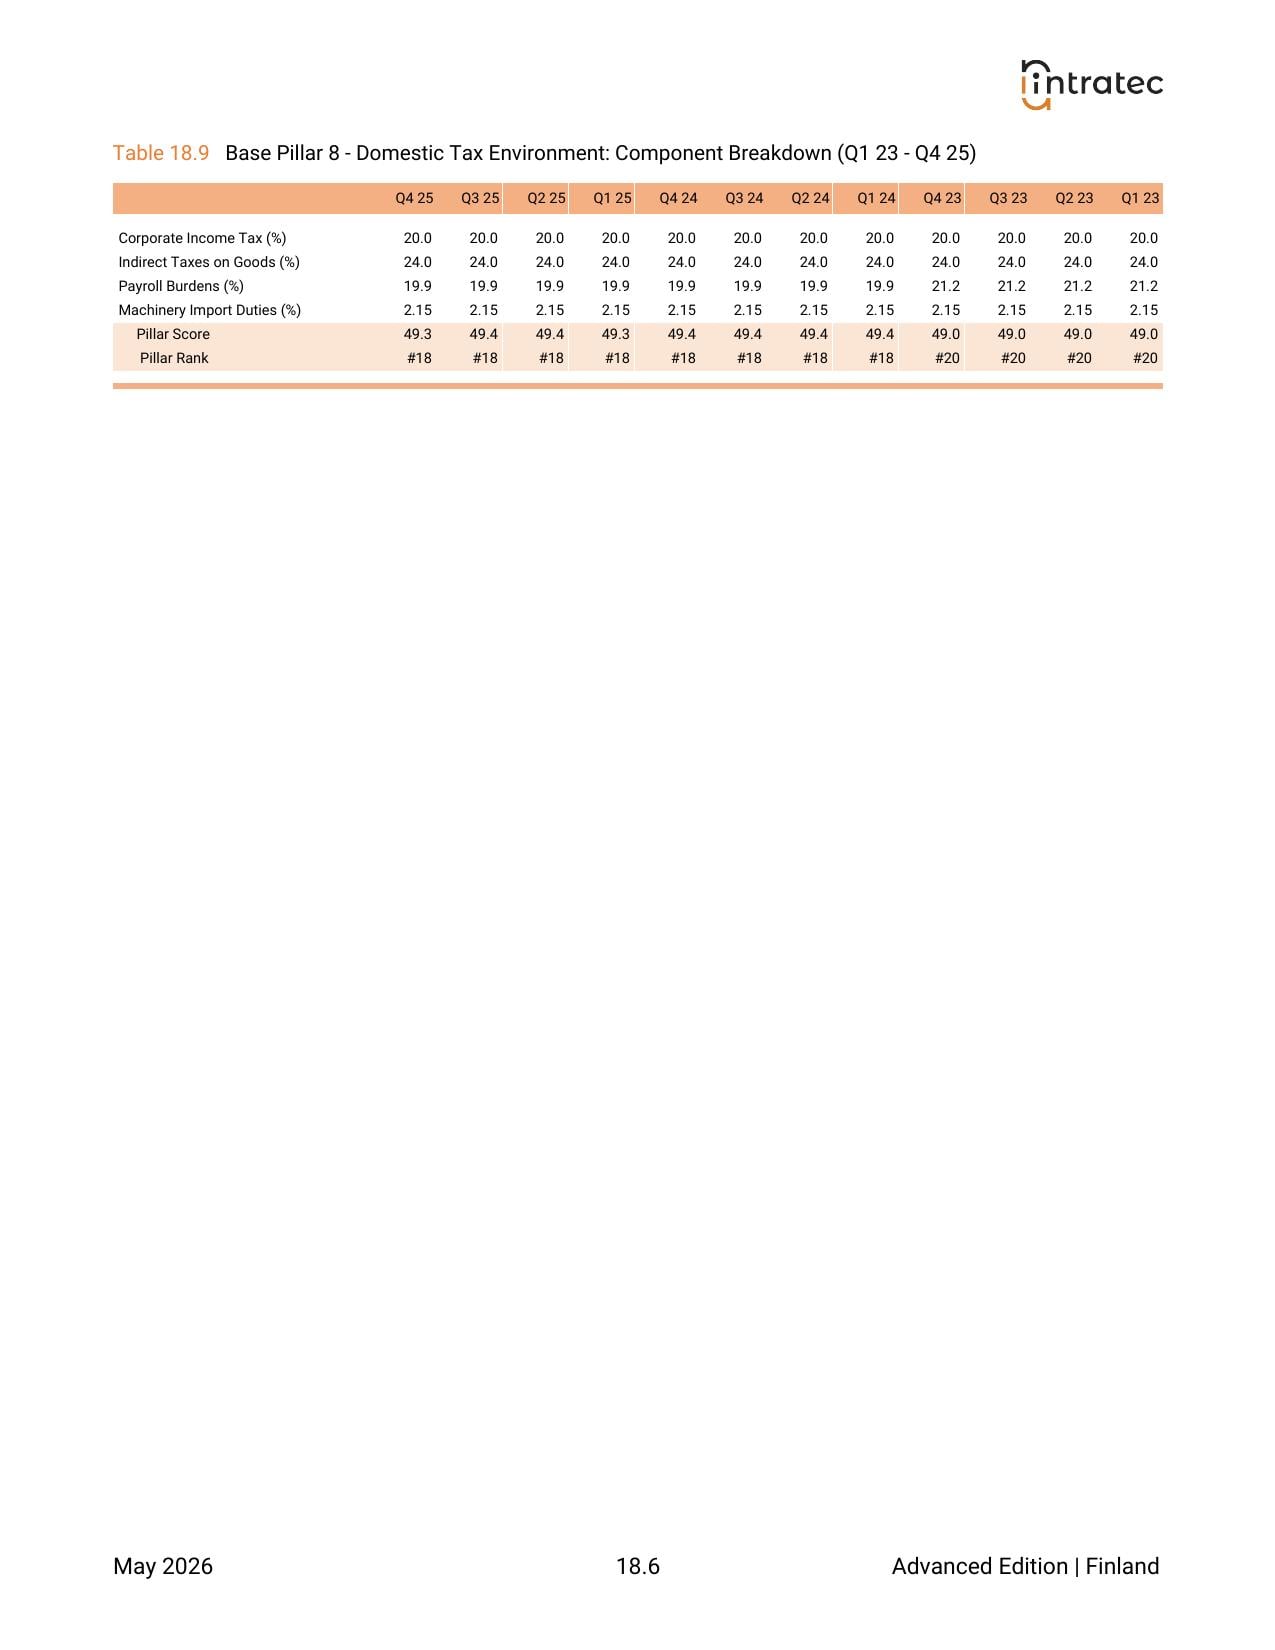
Domestic Tax Environment - Pillar Breakdown
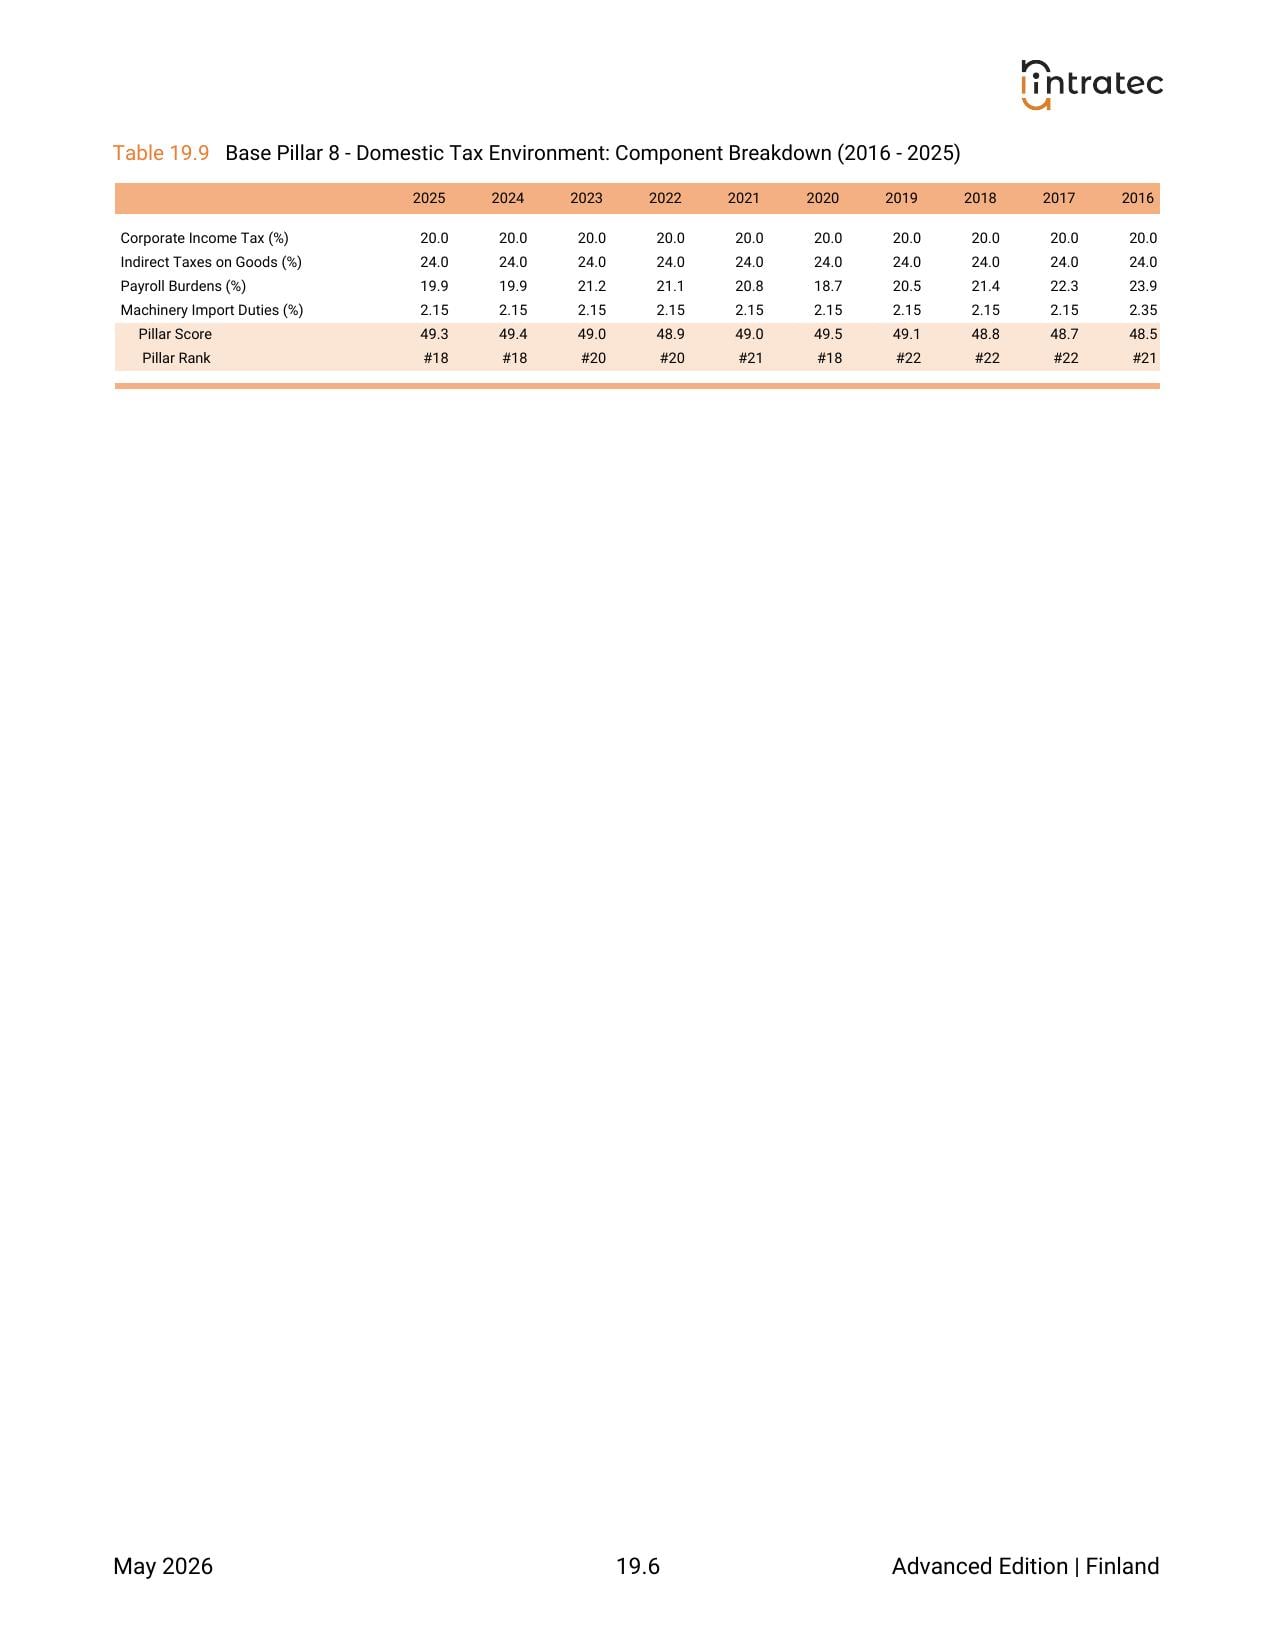
Each of the 4 tax rates benchmarked against peer countries and a side-by-side view of where the country sits on corporate income tax and indirect tax at the same time.
Commodity Prices - Country Performance
The country's overall commodity-prices ranking, plus per-sector rankings across the 7 industrial sectors and price trends over the past 12 months.
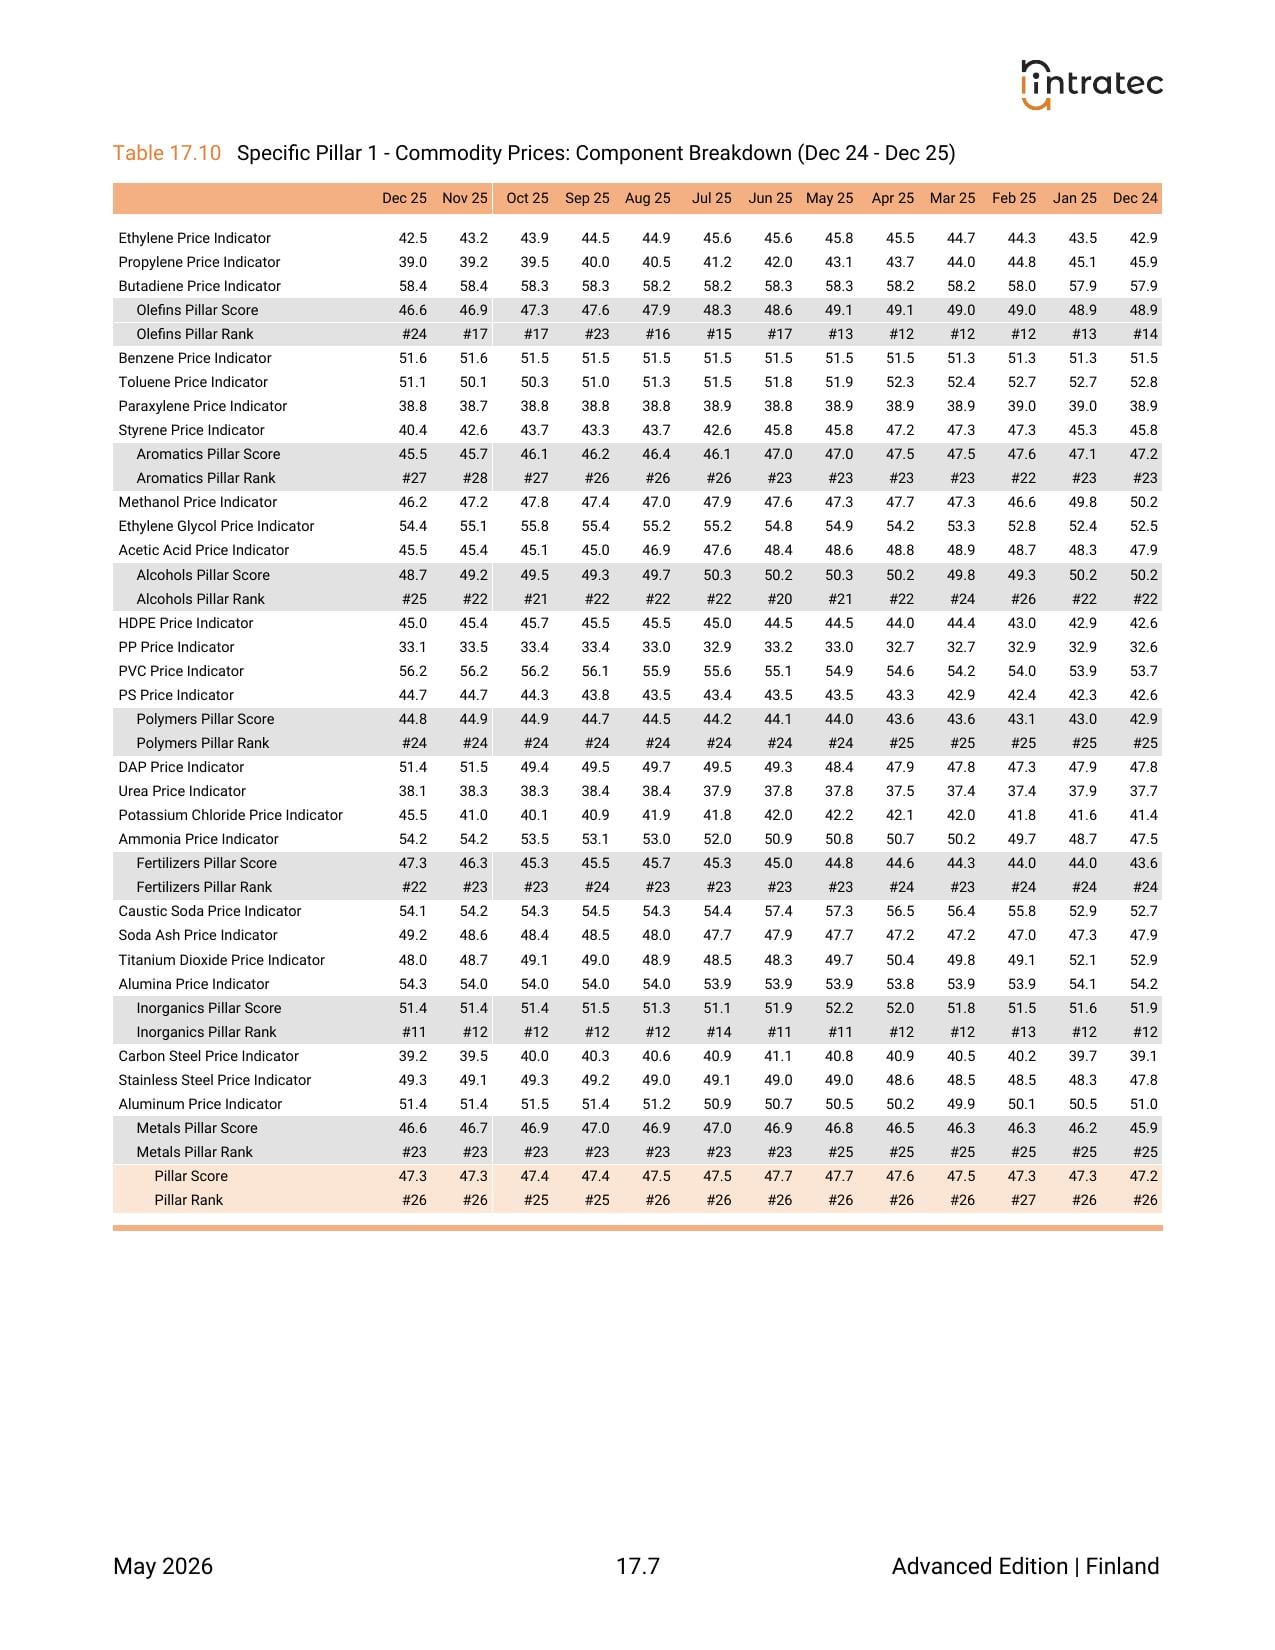
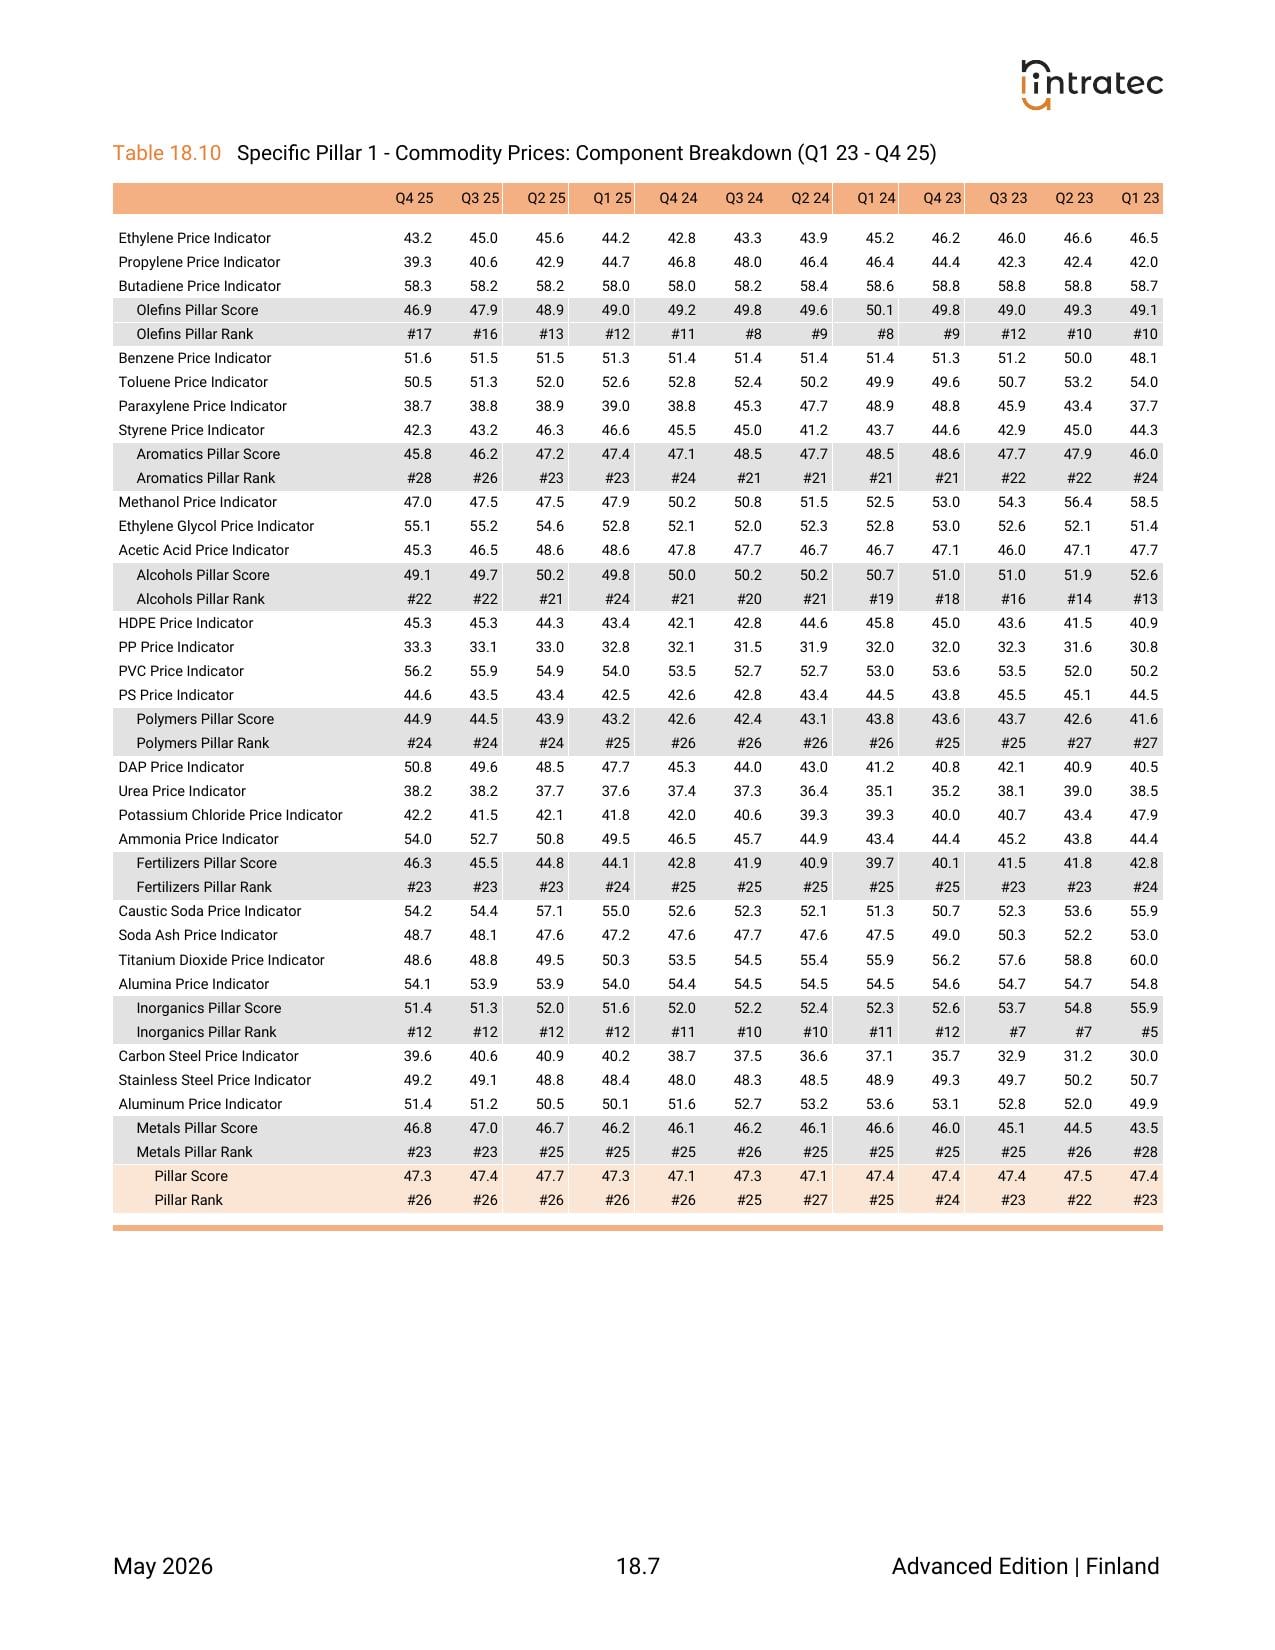
Commodity Prices - Pillar Breakdown
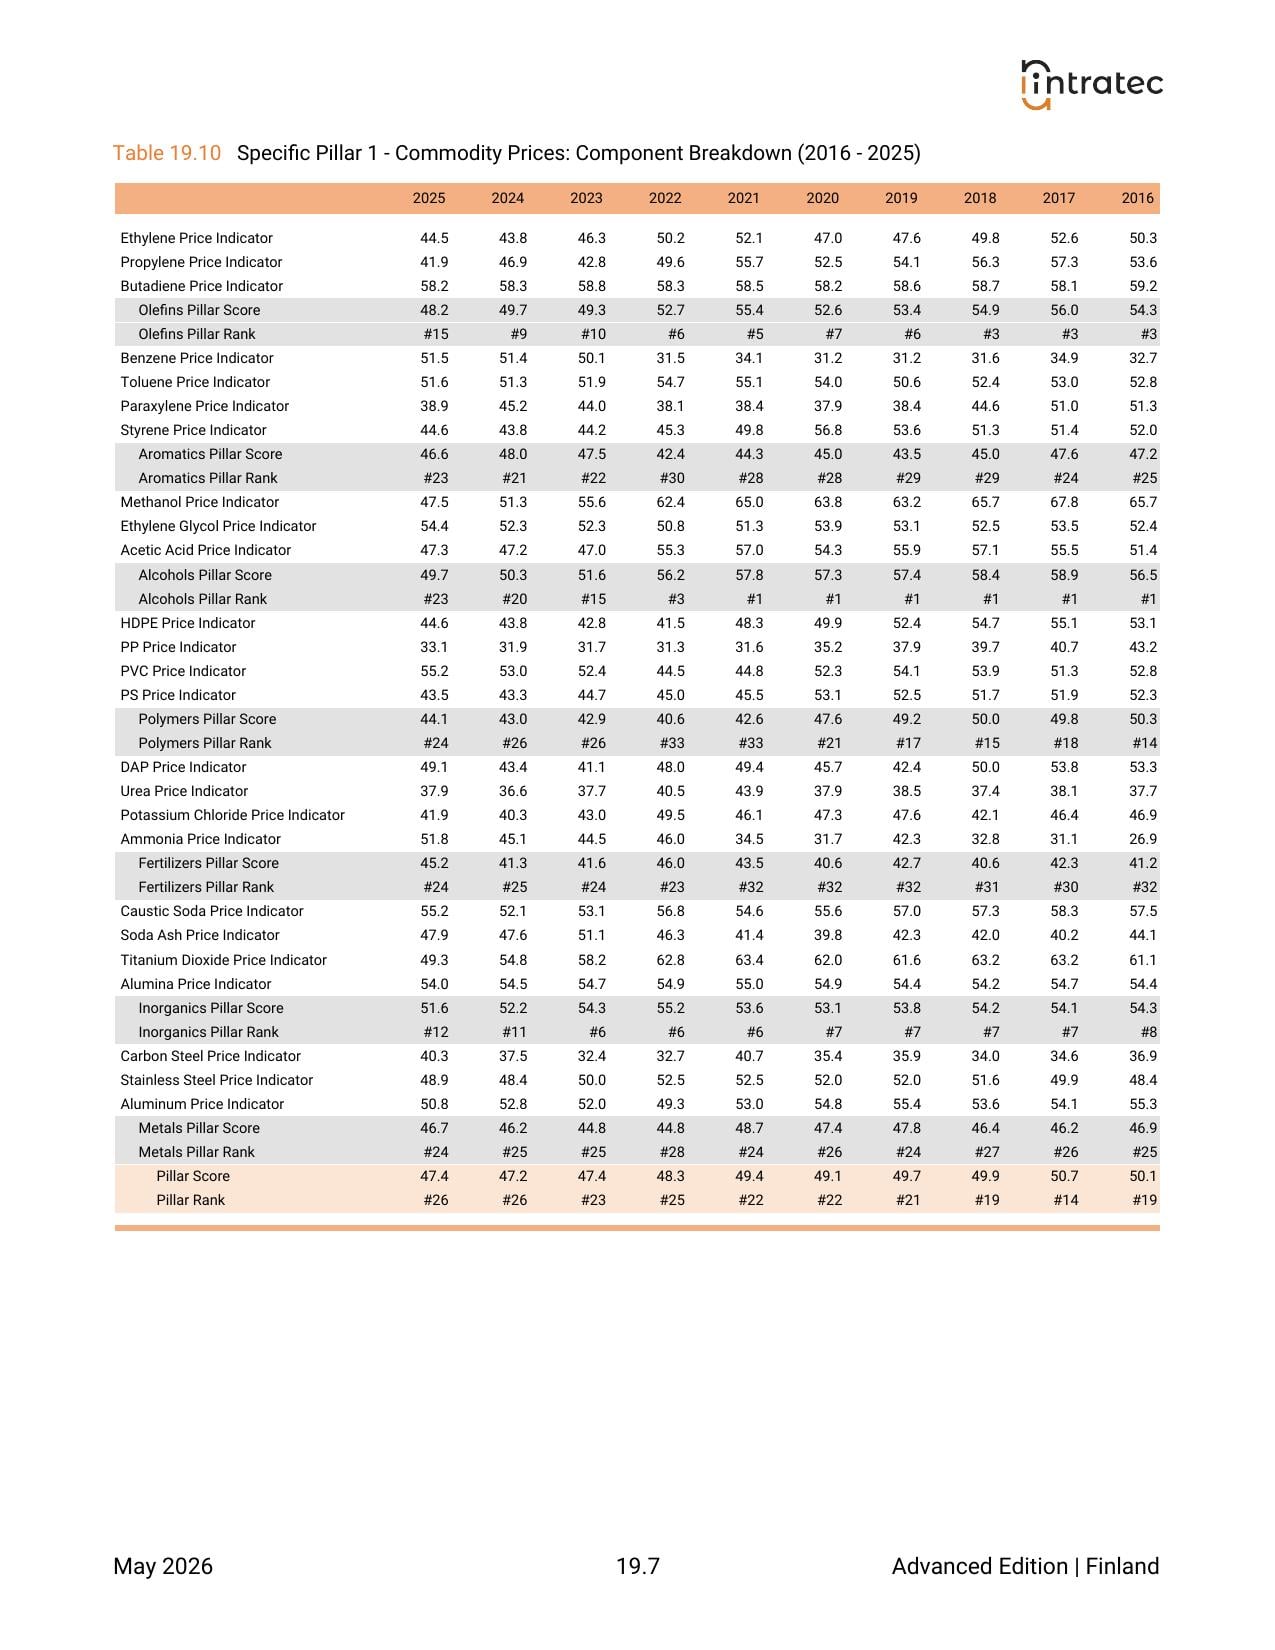
Domestic price indicators for every commodity tracked in the program, benchmarked against global references, with a price-trend view across all 7 sectors over the past 12 months.
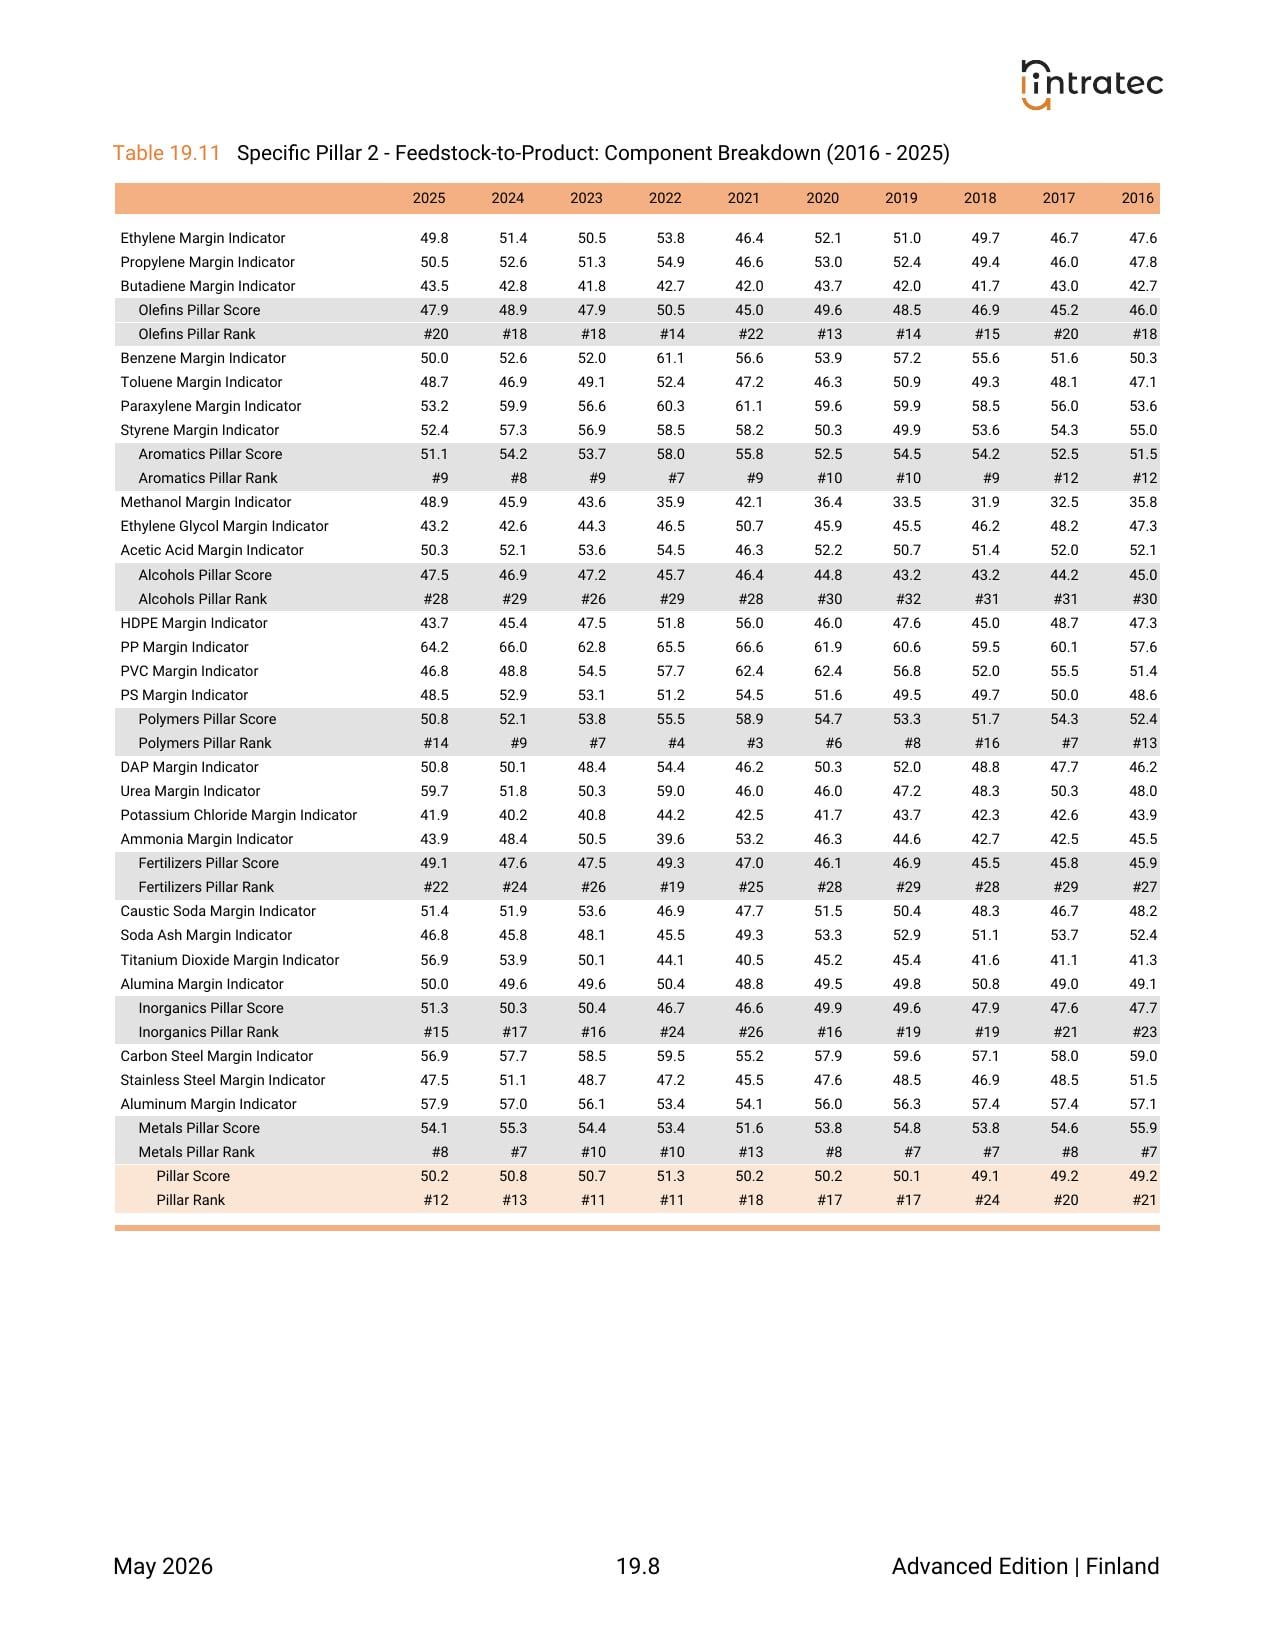
Feedstock-to-Product Margins - Country Performance
The country's overall margins ranking — capturing the spread between feedstock costs and product prices — with per-sector standings across the 7 industrial sectors and margin trends over the past 12 months.
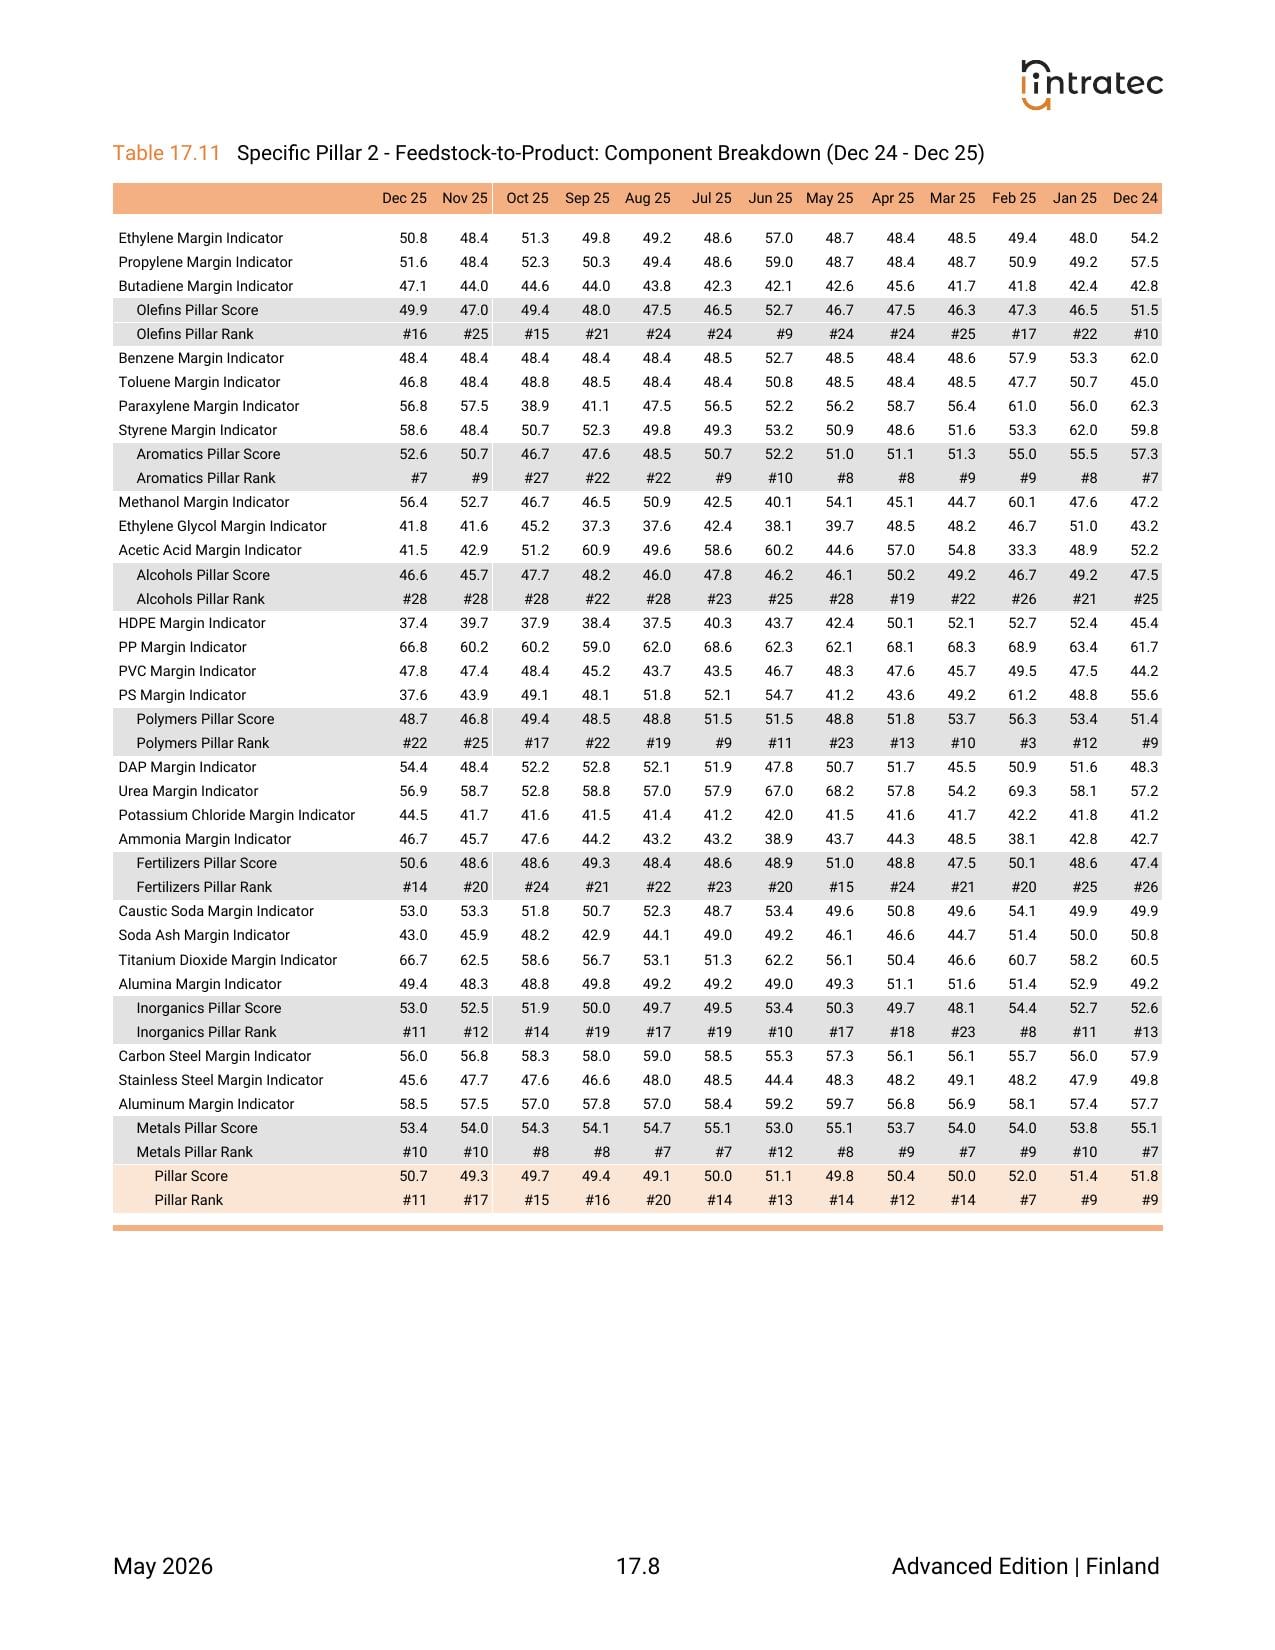
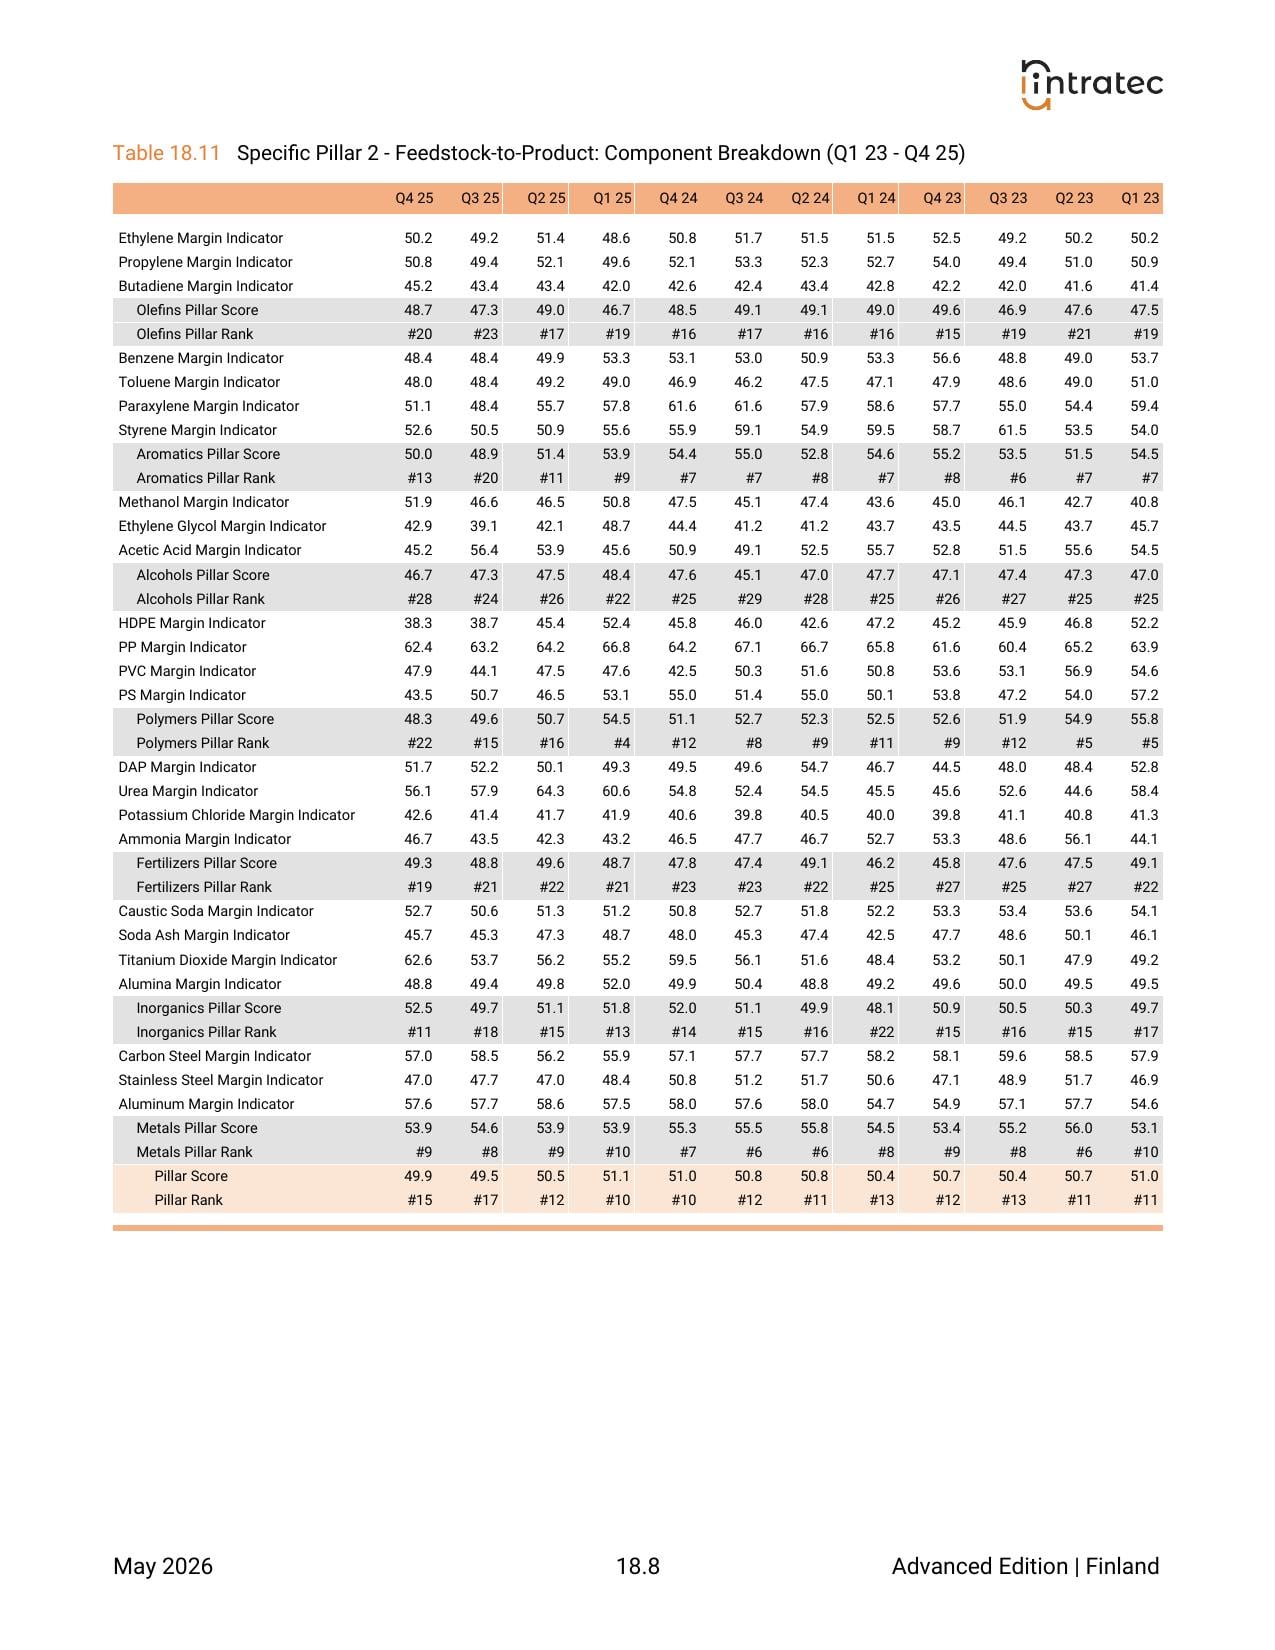
Feedstock-to-Product Margins - Pillar Breakdown
Margin indicators for every commodity in the program by dominant production route, benchmarked globally, with margin trends across all 7 sectors over the past 12 months.
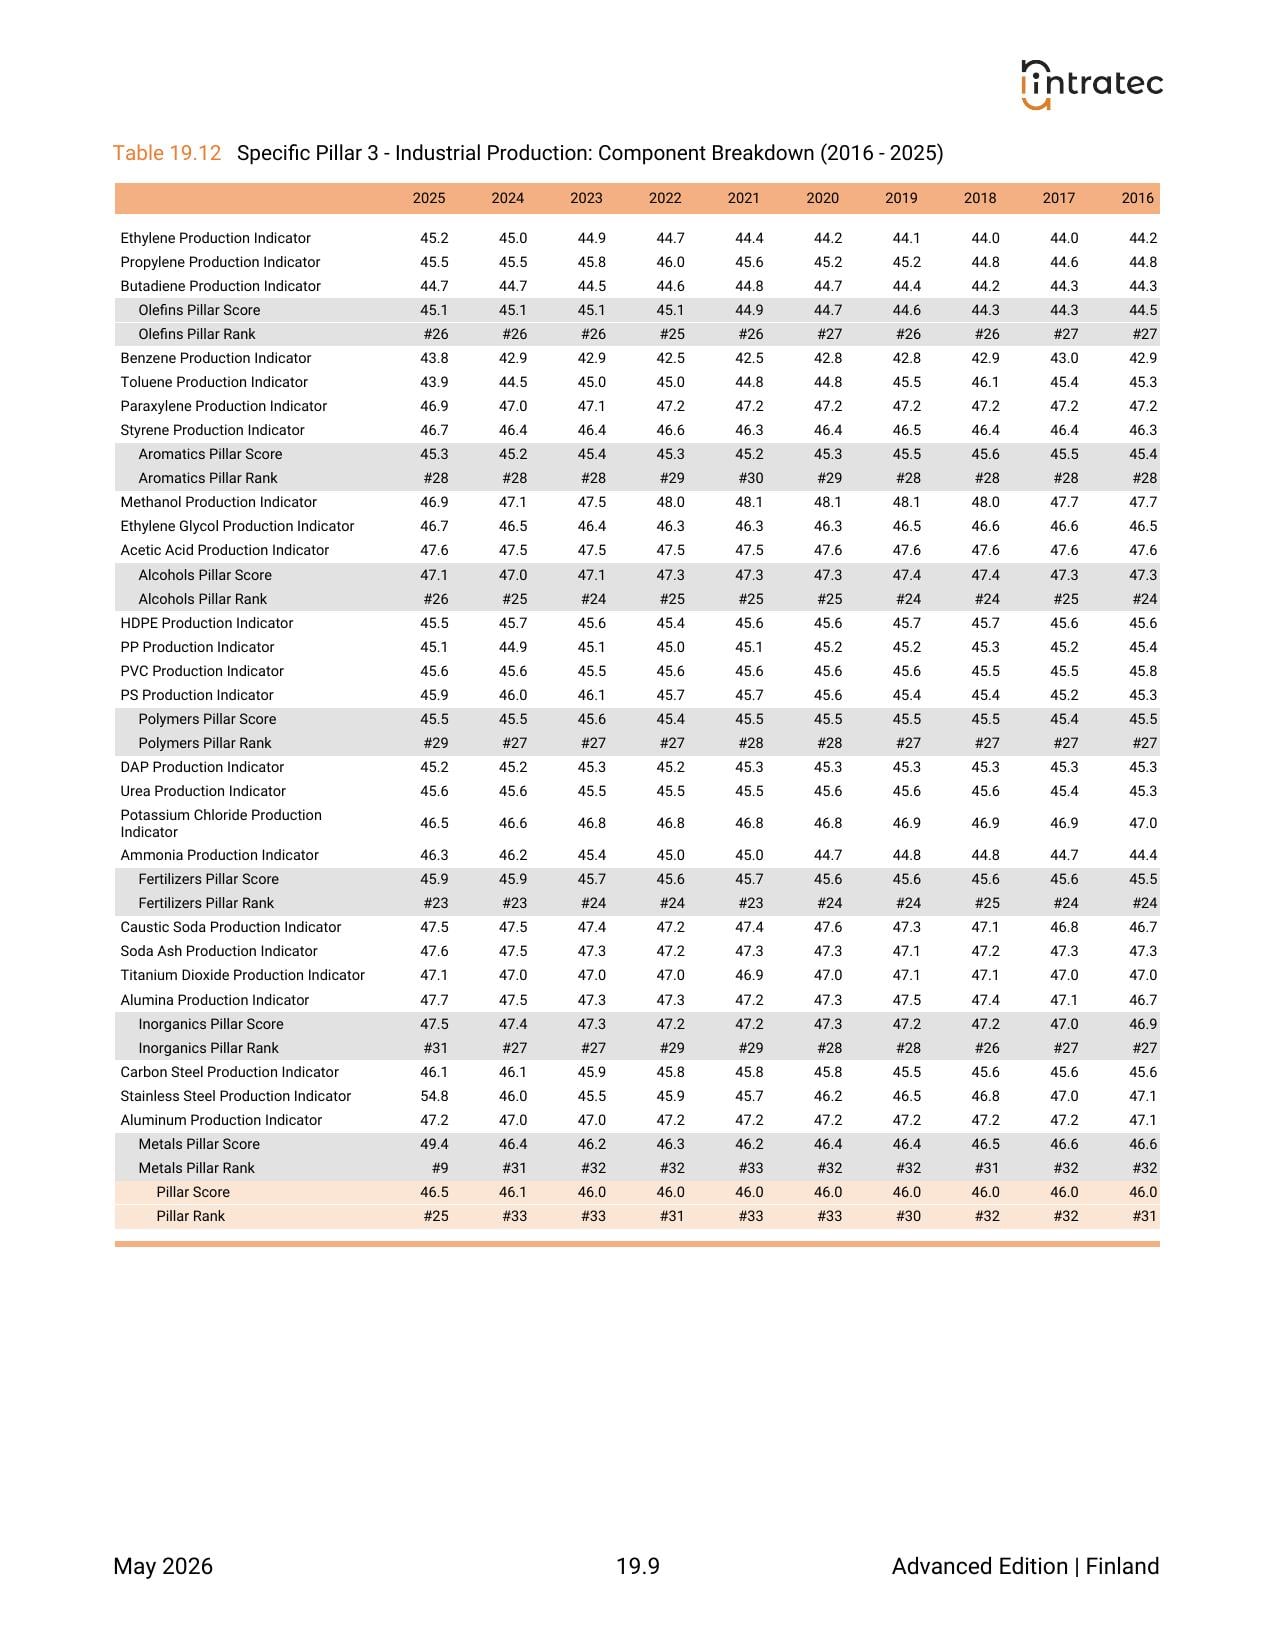
Industrial Production - Country Performance
The country's overall industrial-production ranking, with per-sector standings showing how much it actually produces in each of the 7 industrial sectors.
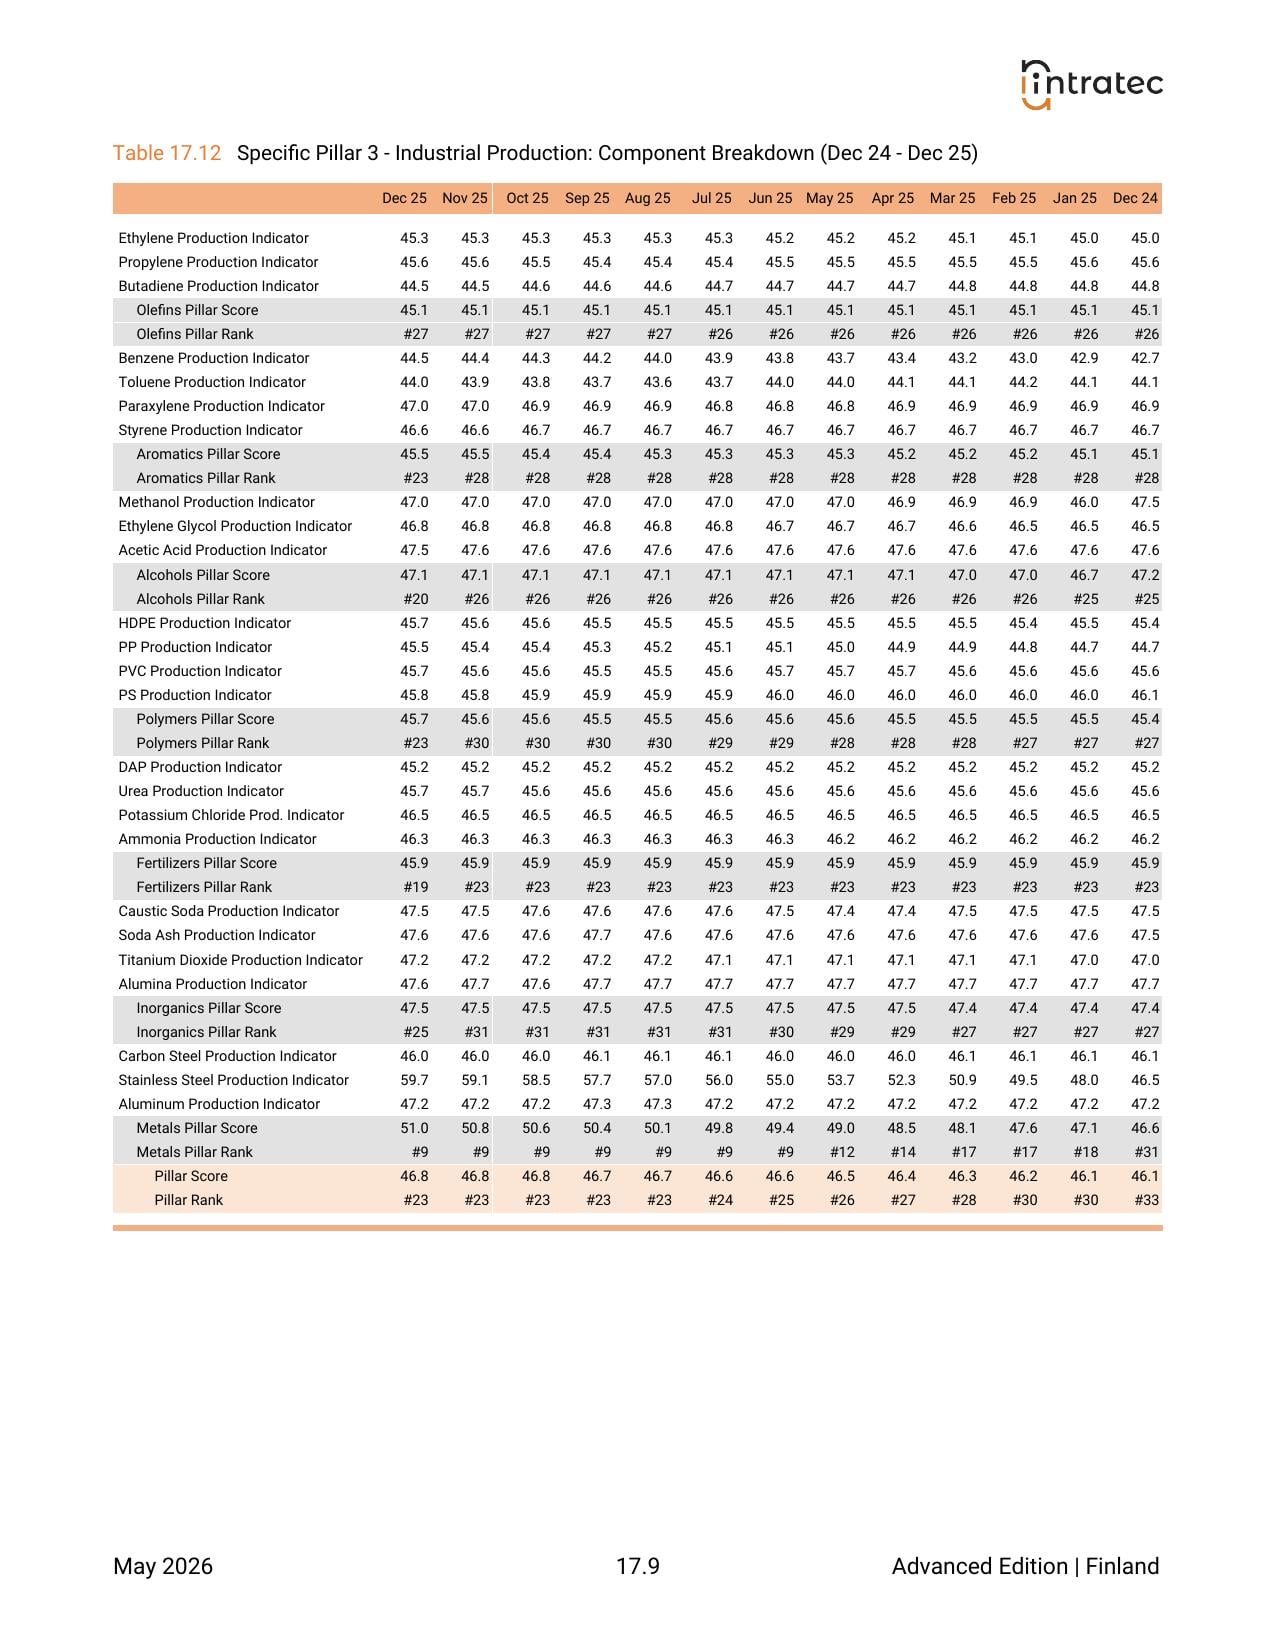
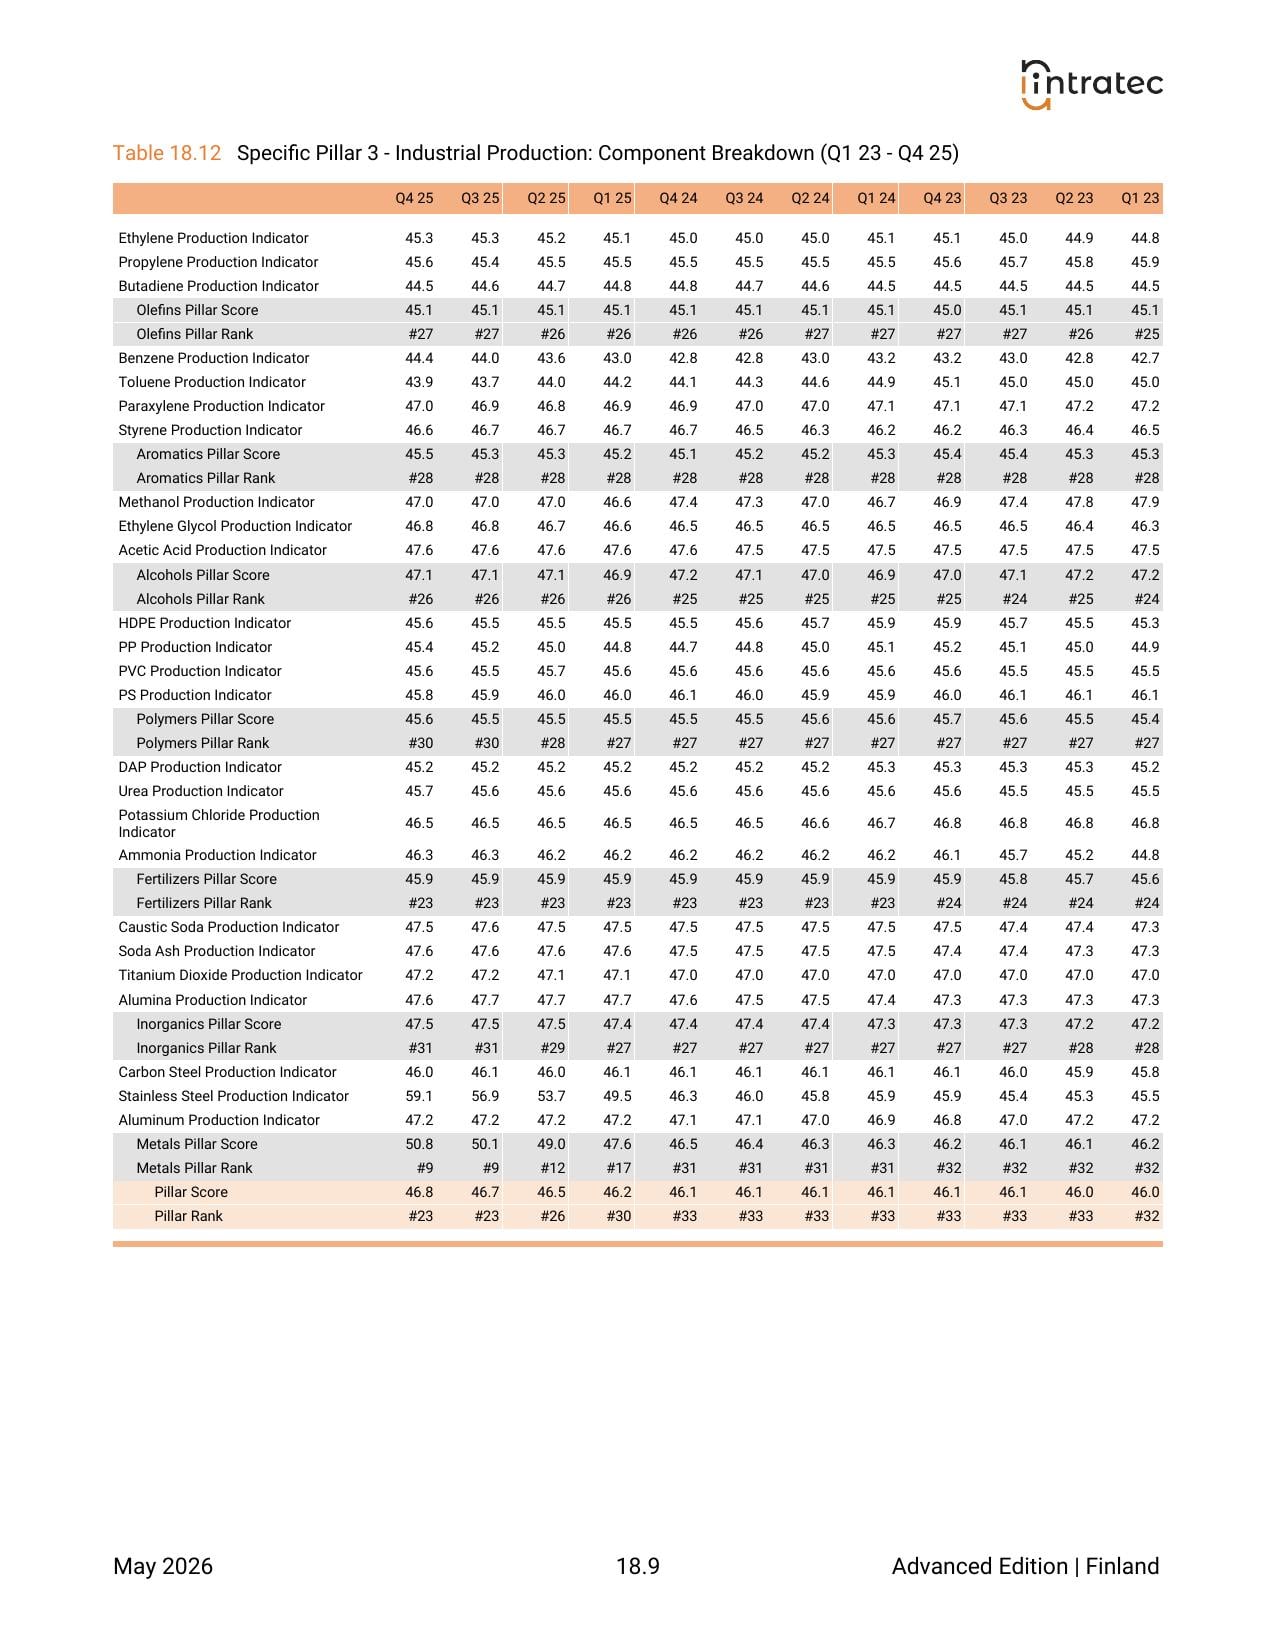
Industrial Production - Pillar Breakdown
Production-scale indicators for every commodity in the program, benchmarked globally, with production trends across all 7 sectors over the past 12 months.
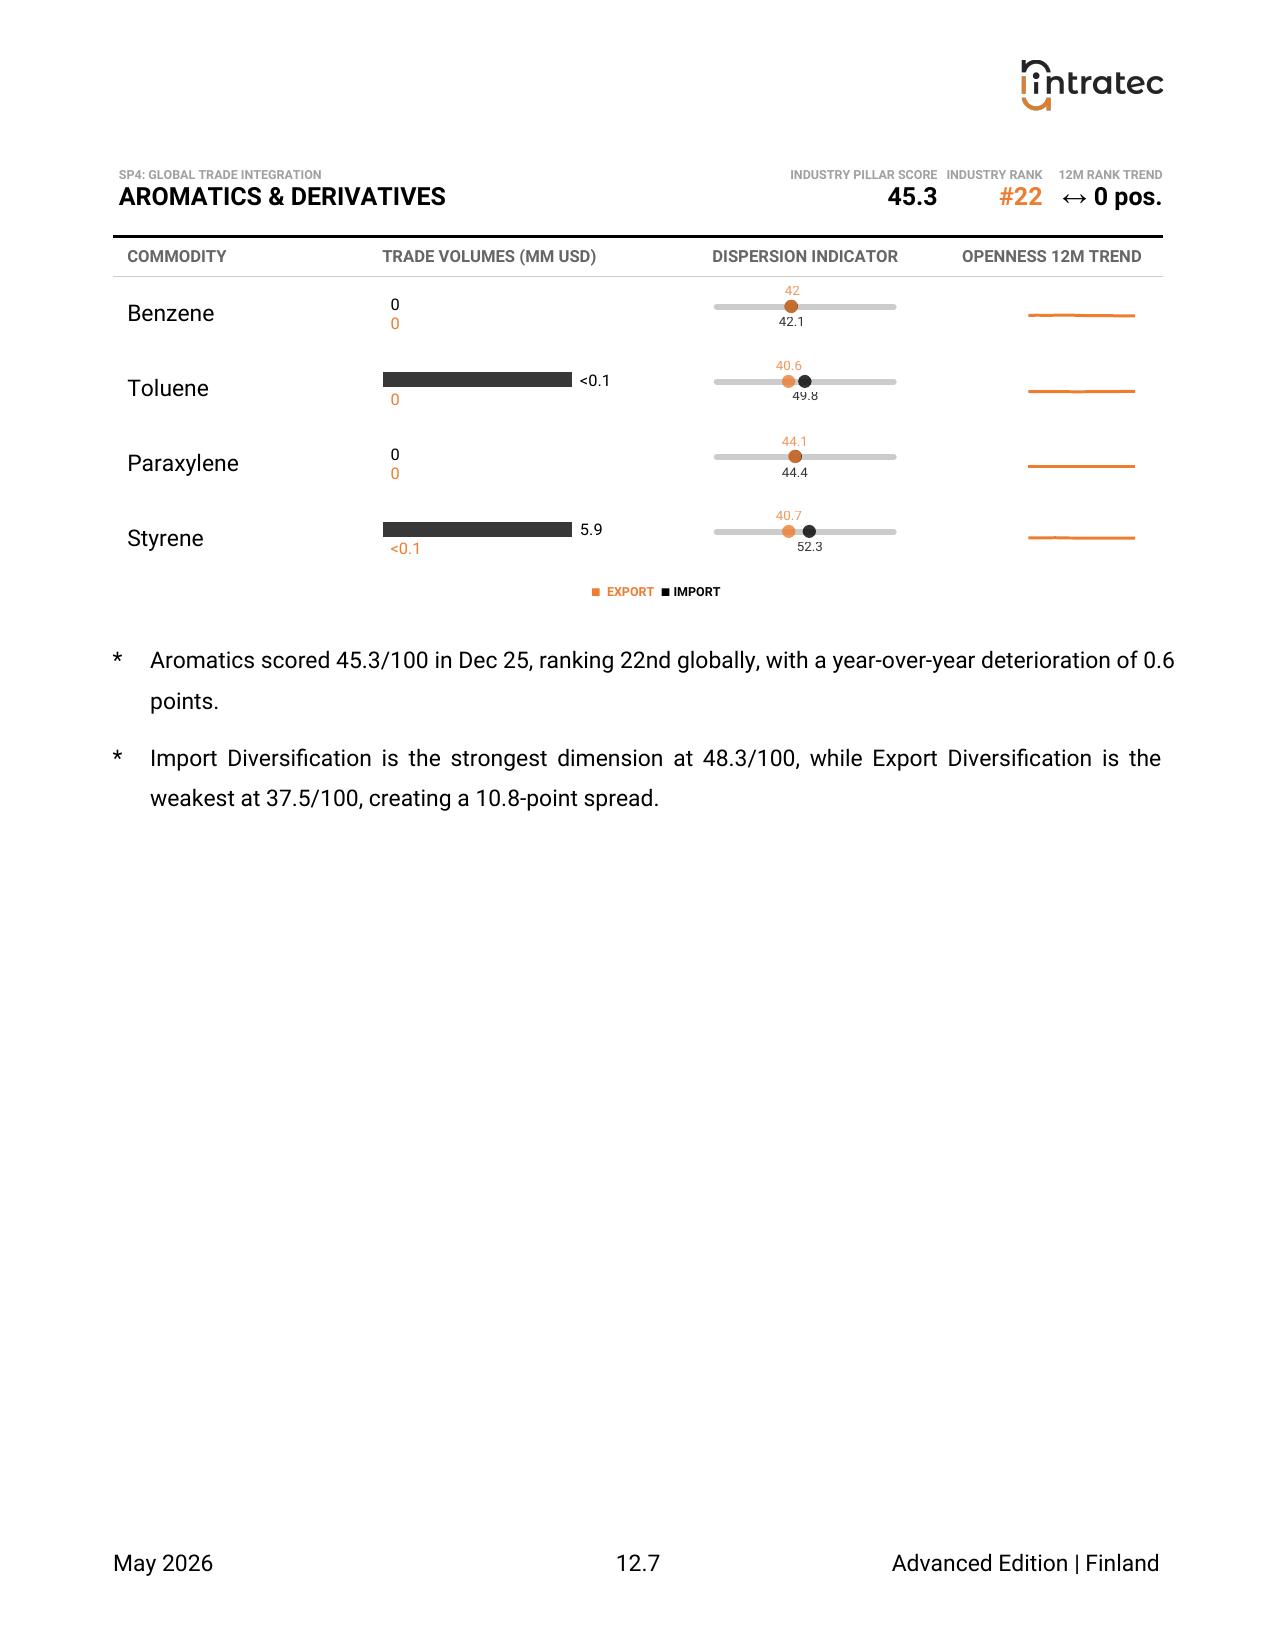
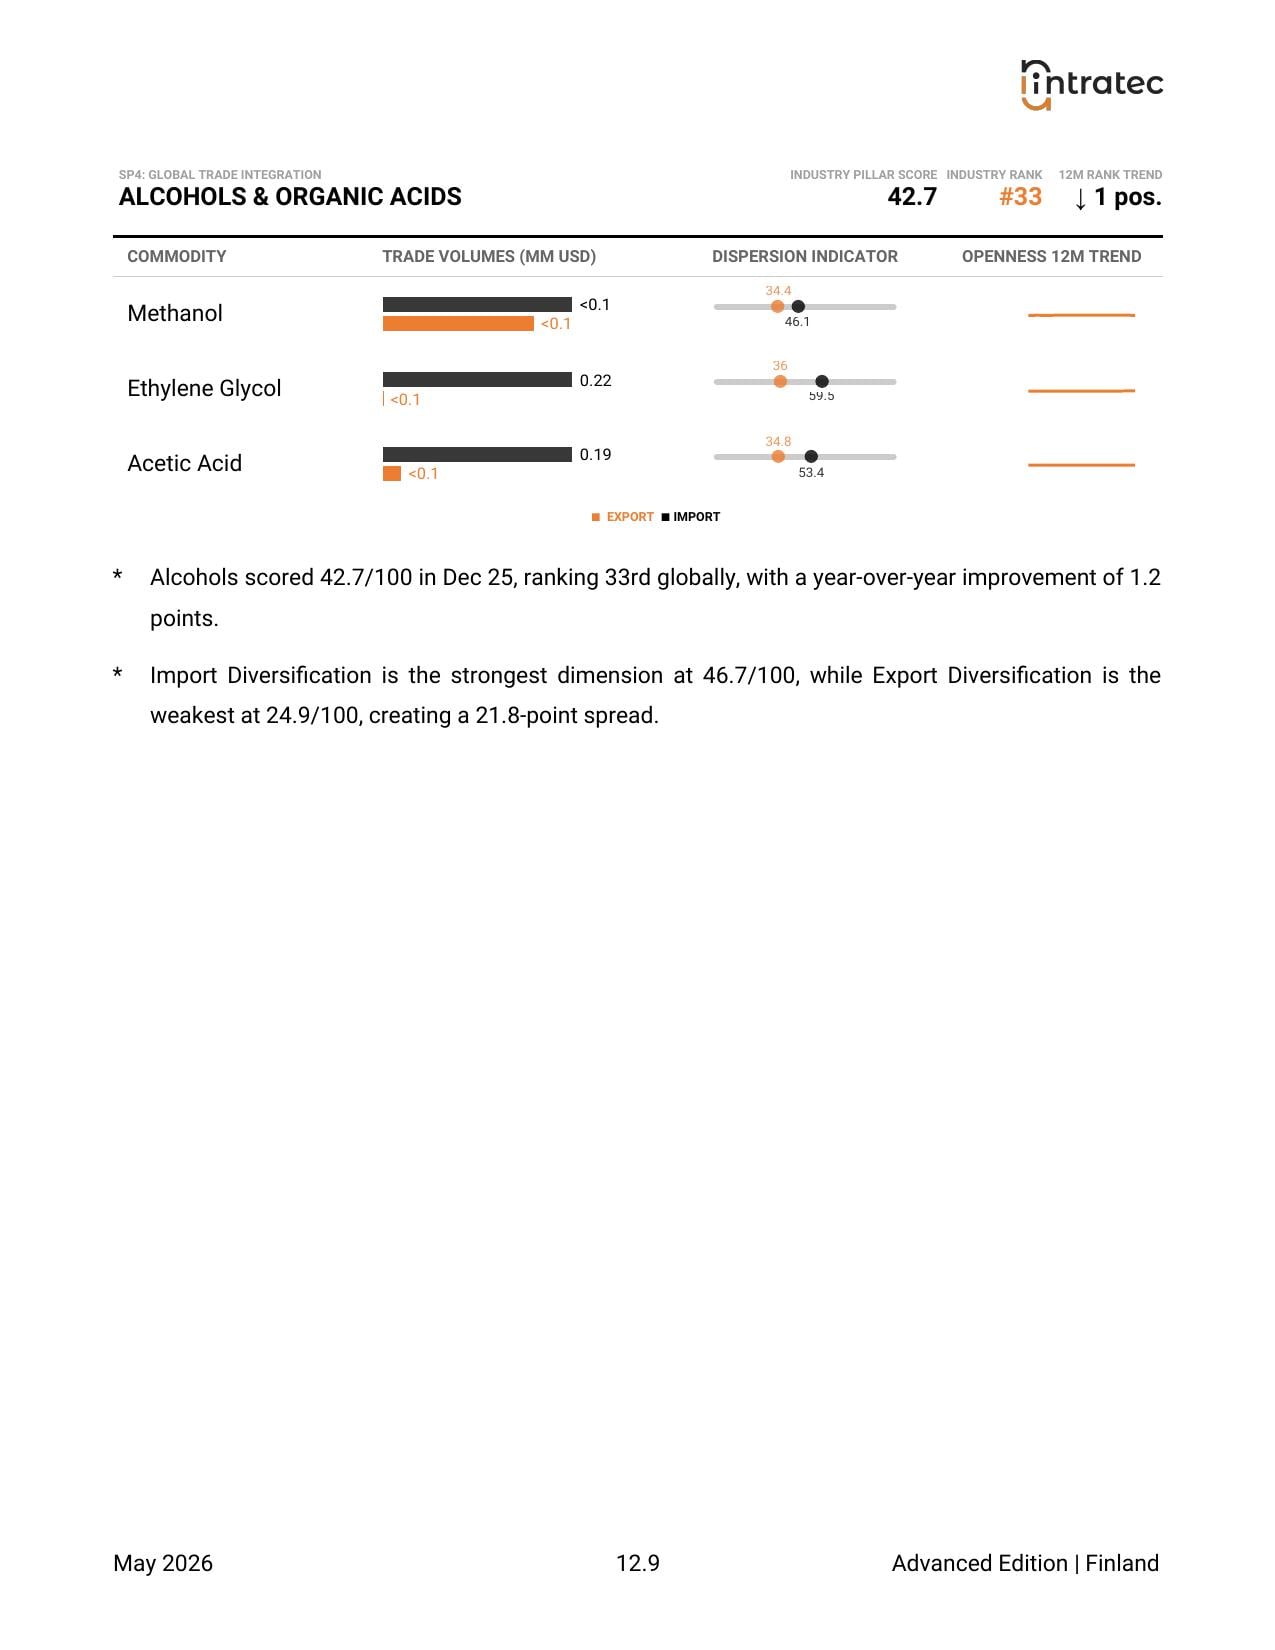
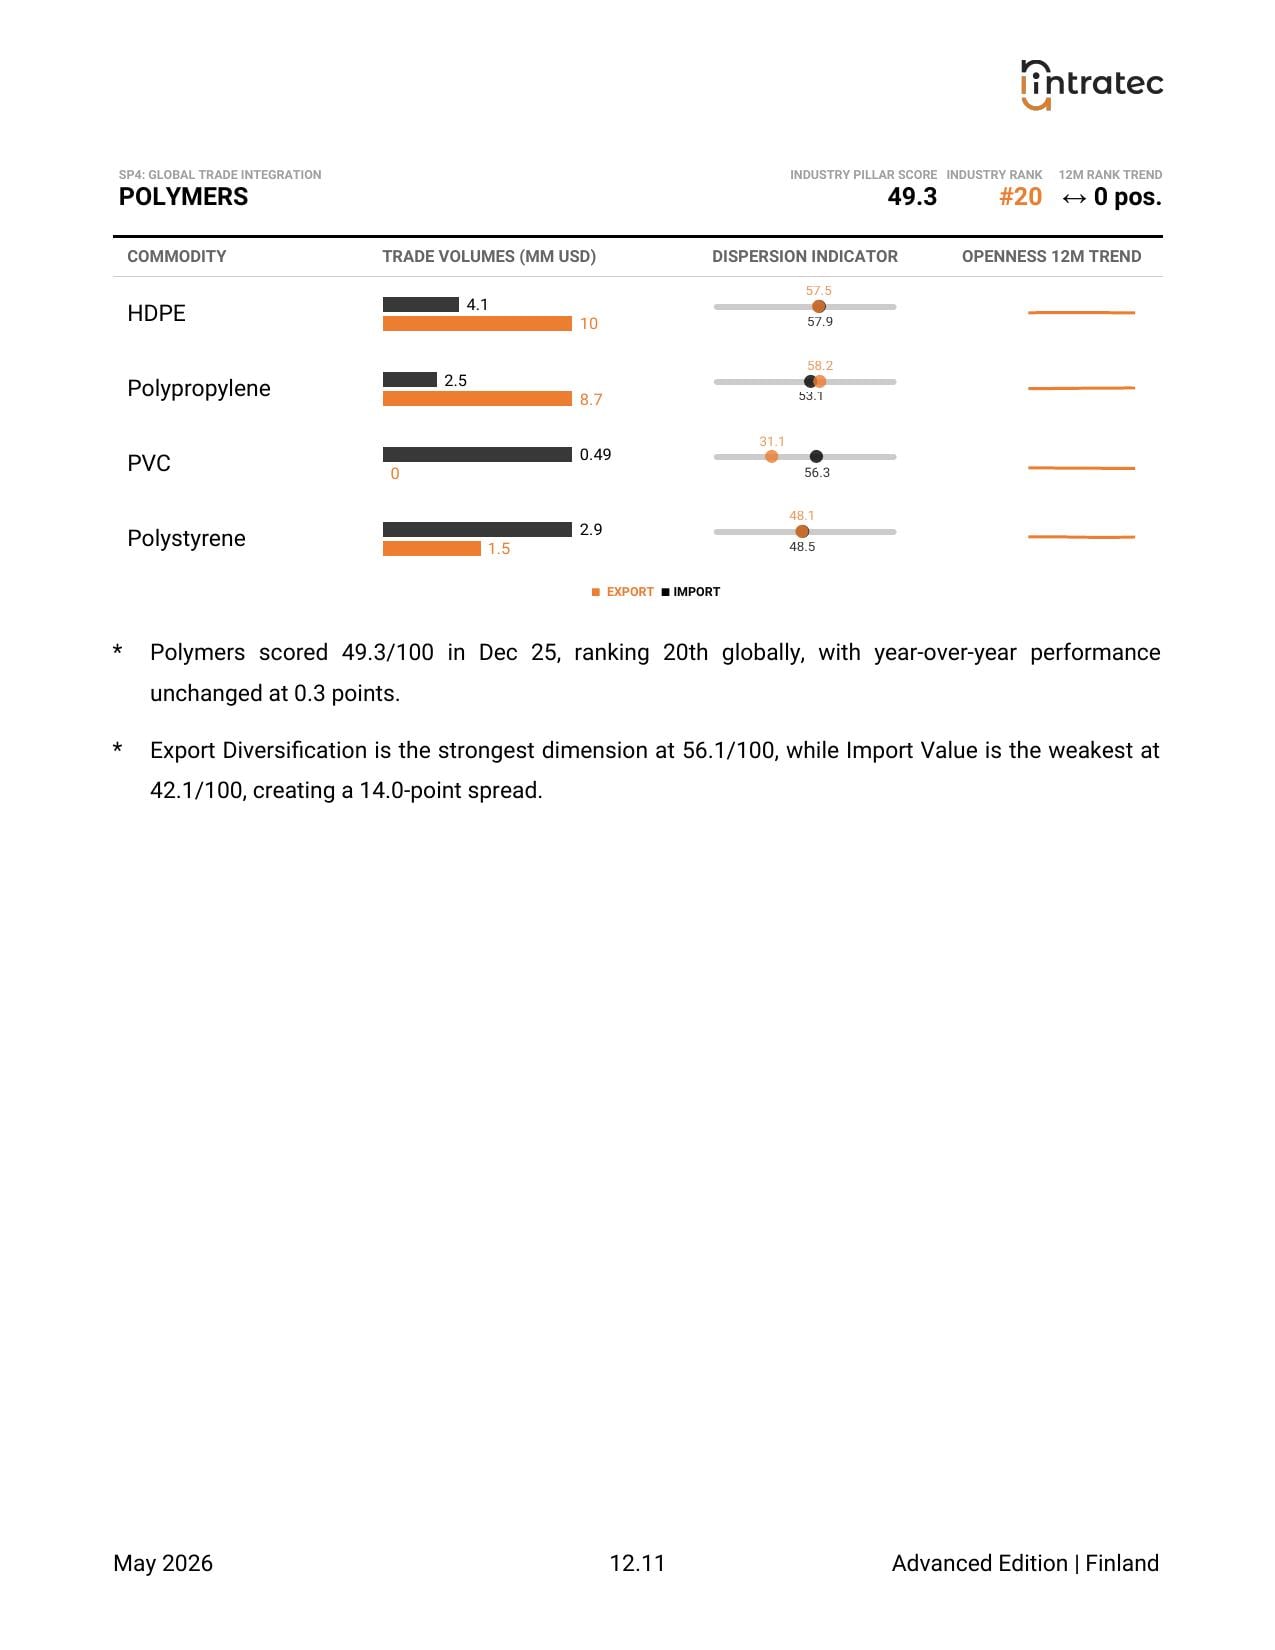
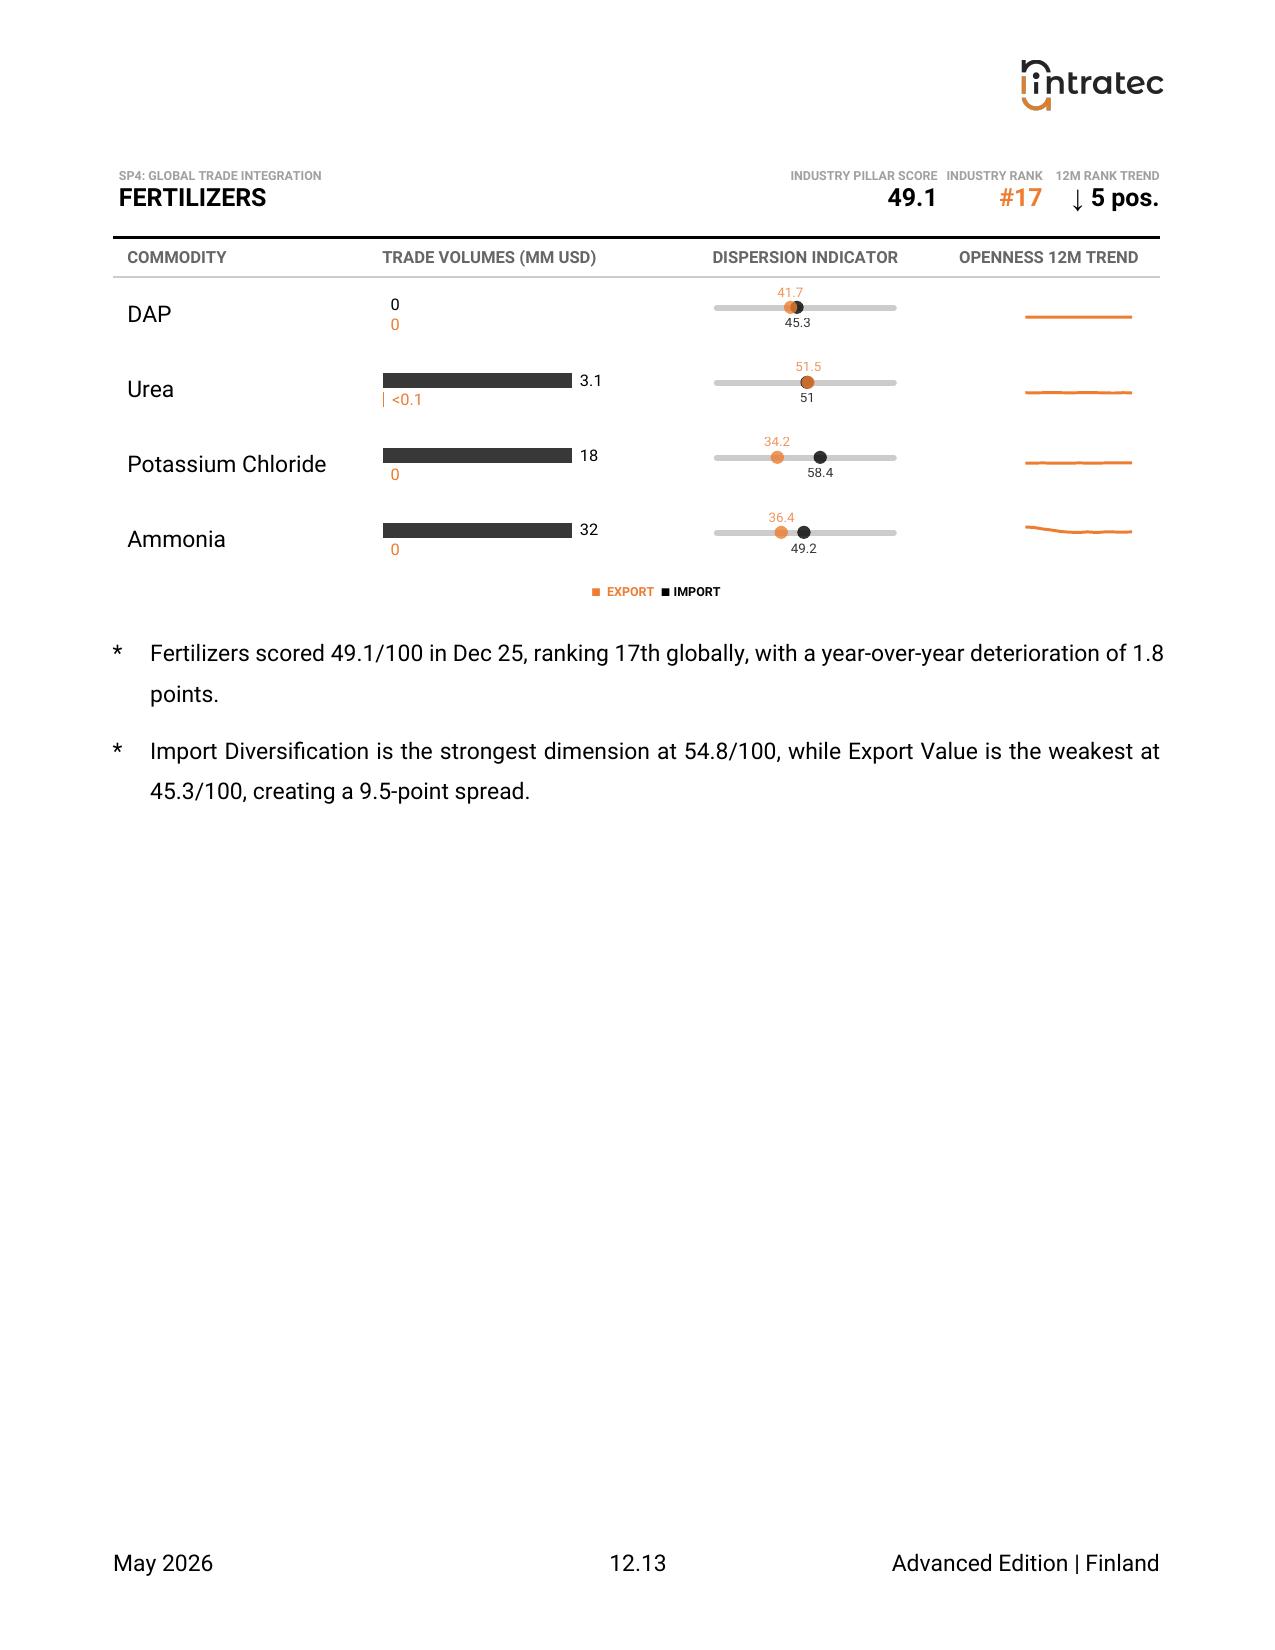
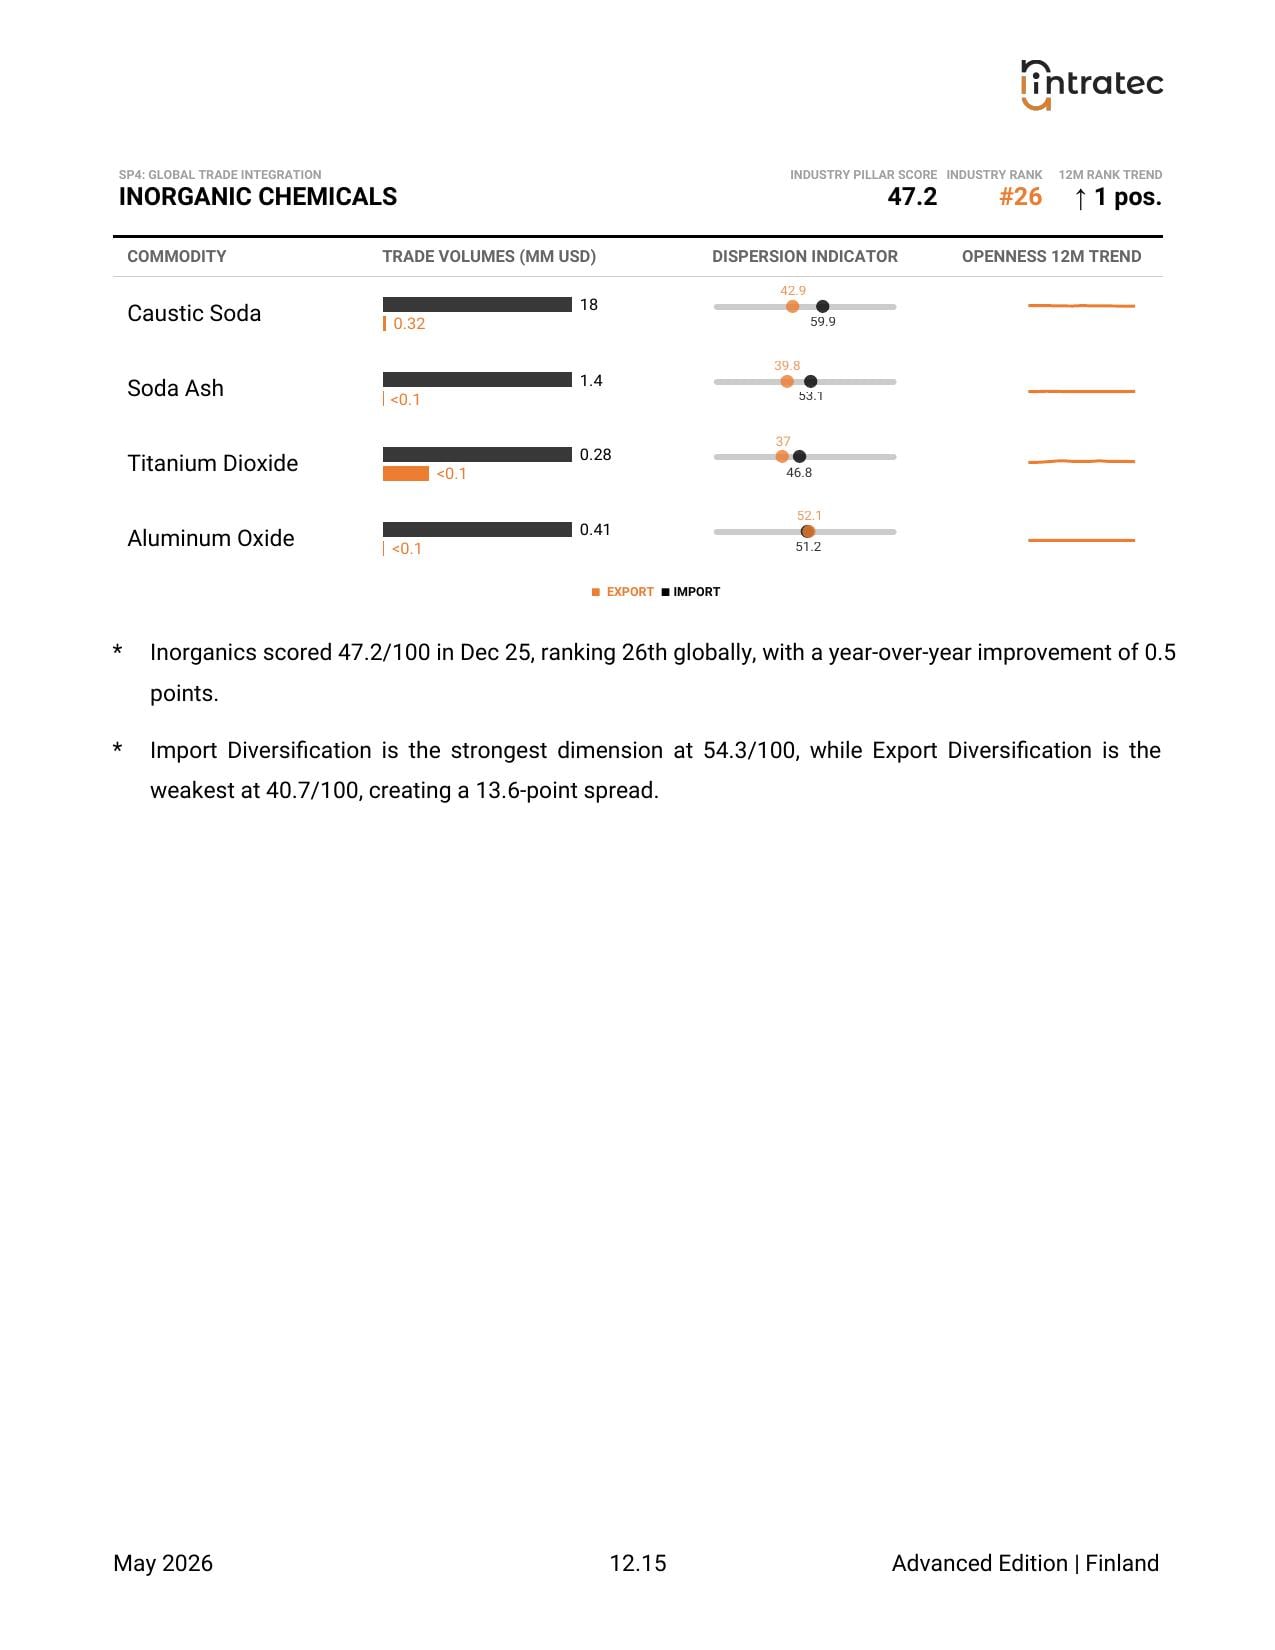
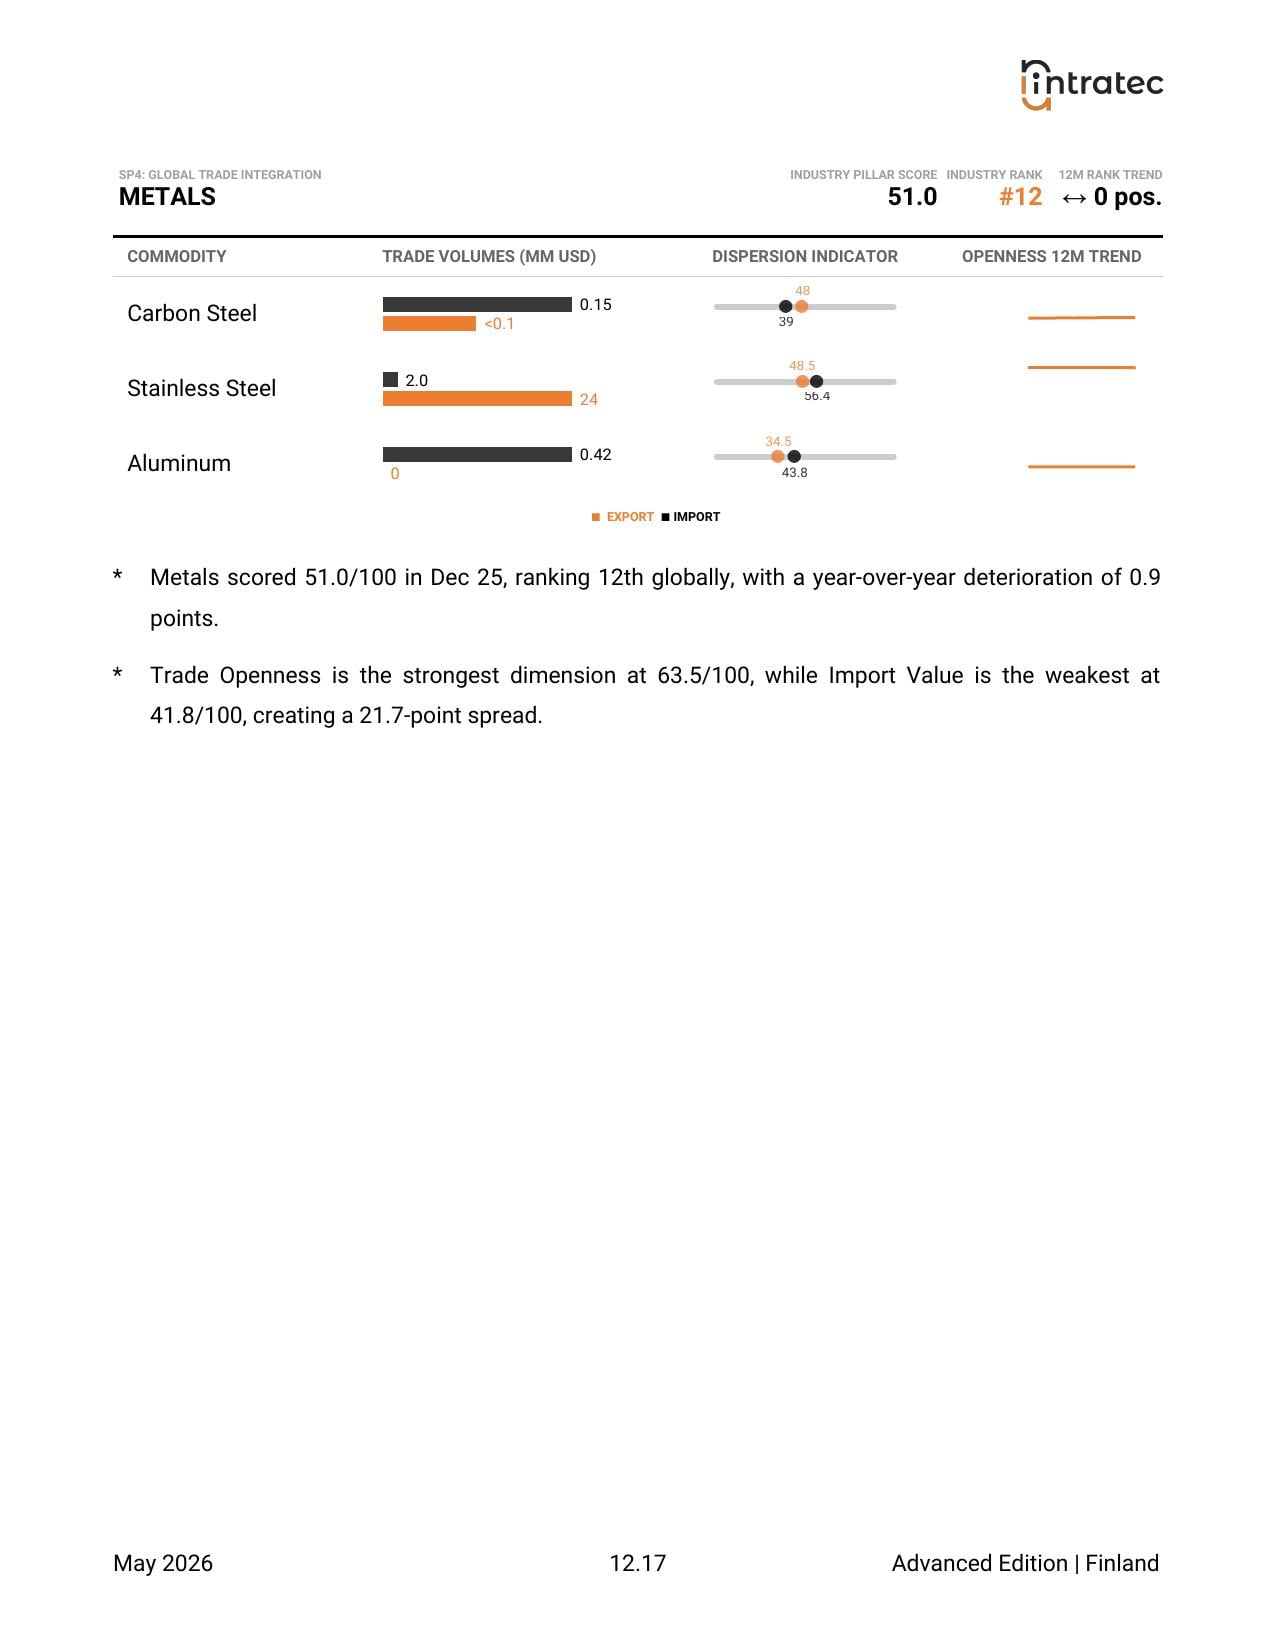
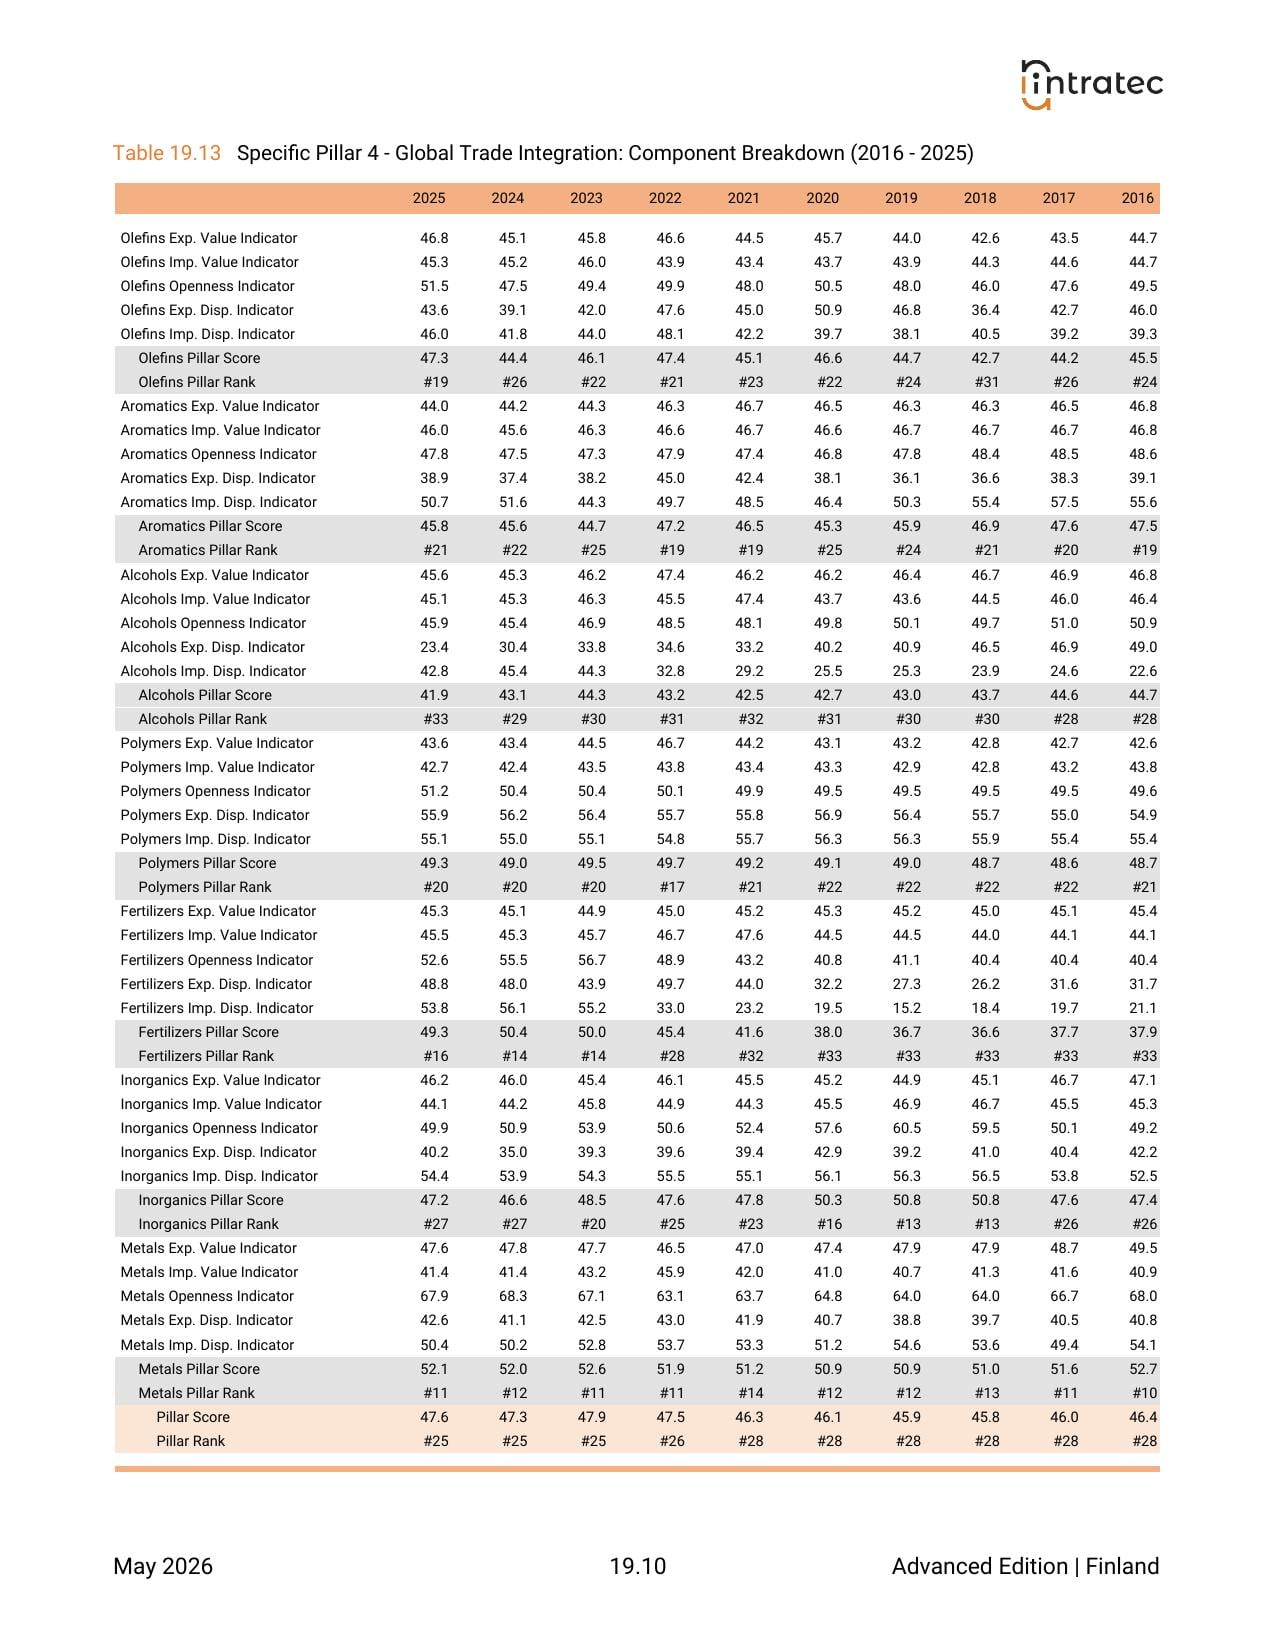
Global Trade Integration - Country Performance
The country's overall trade-integration ranking, with per-sector standings showing how active it is in global trade across the 7 industrial sectors.
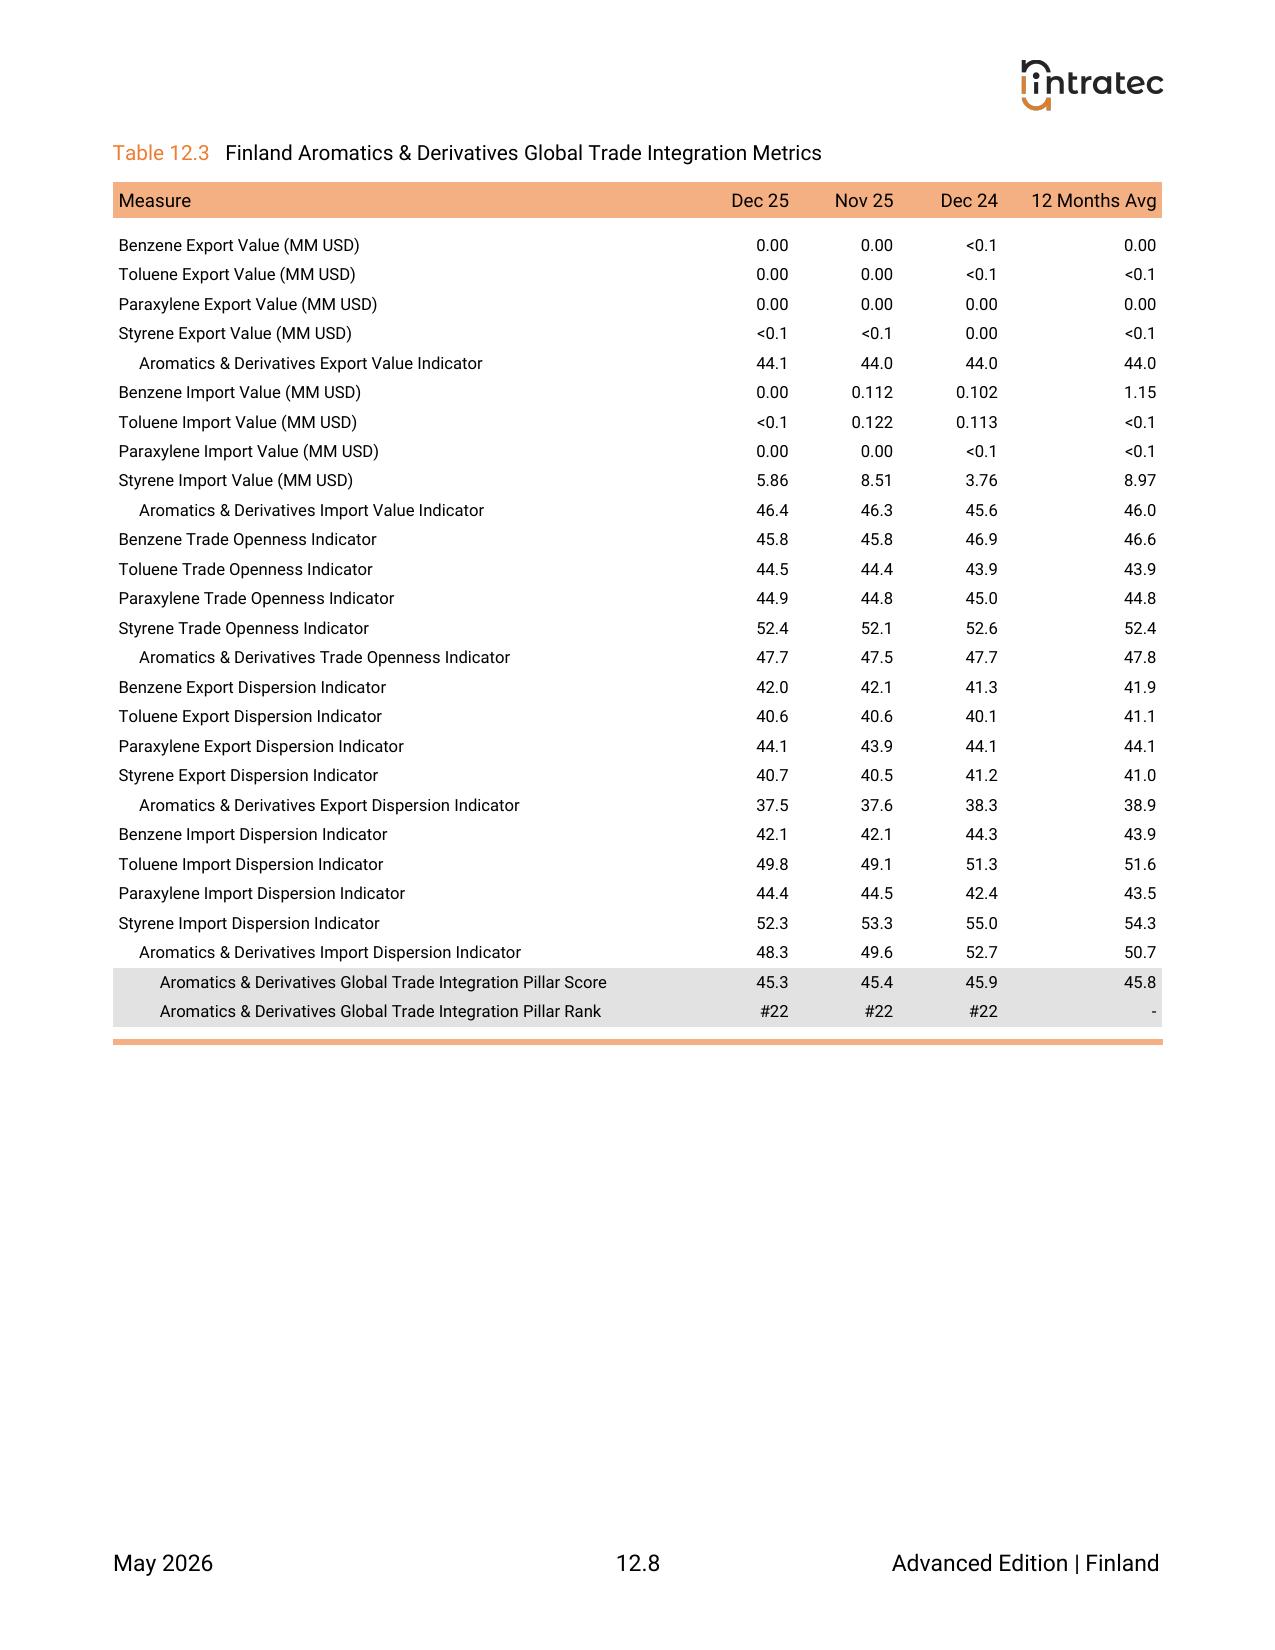
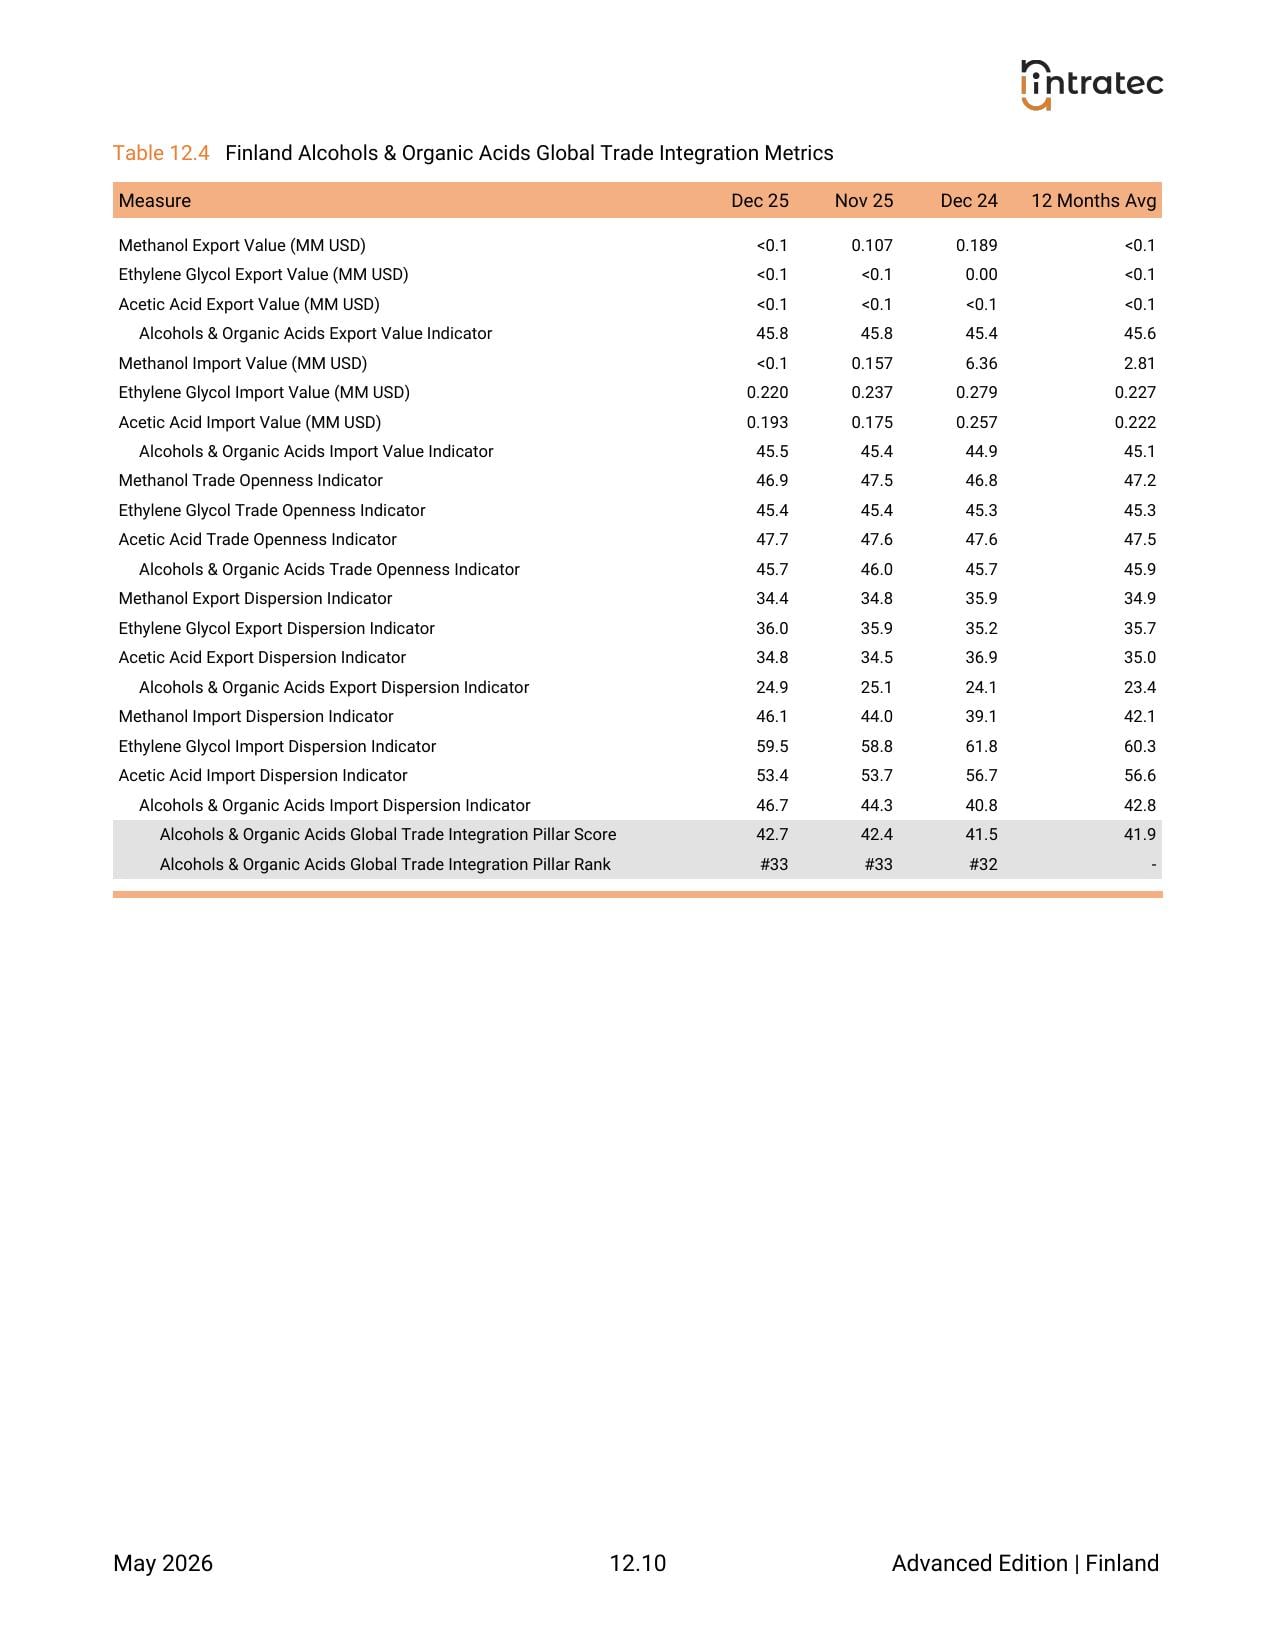
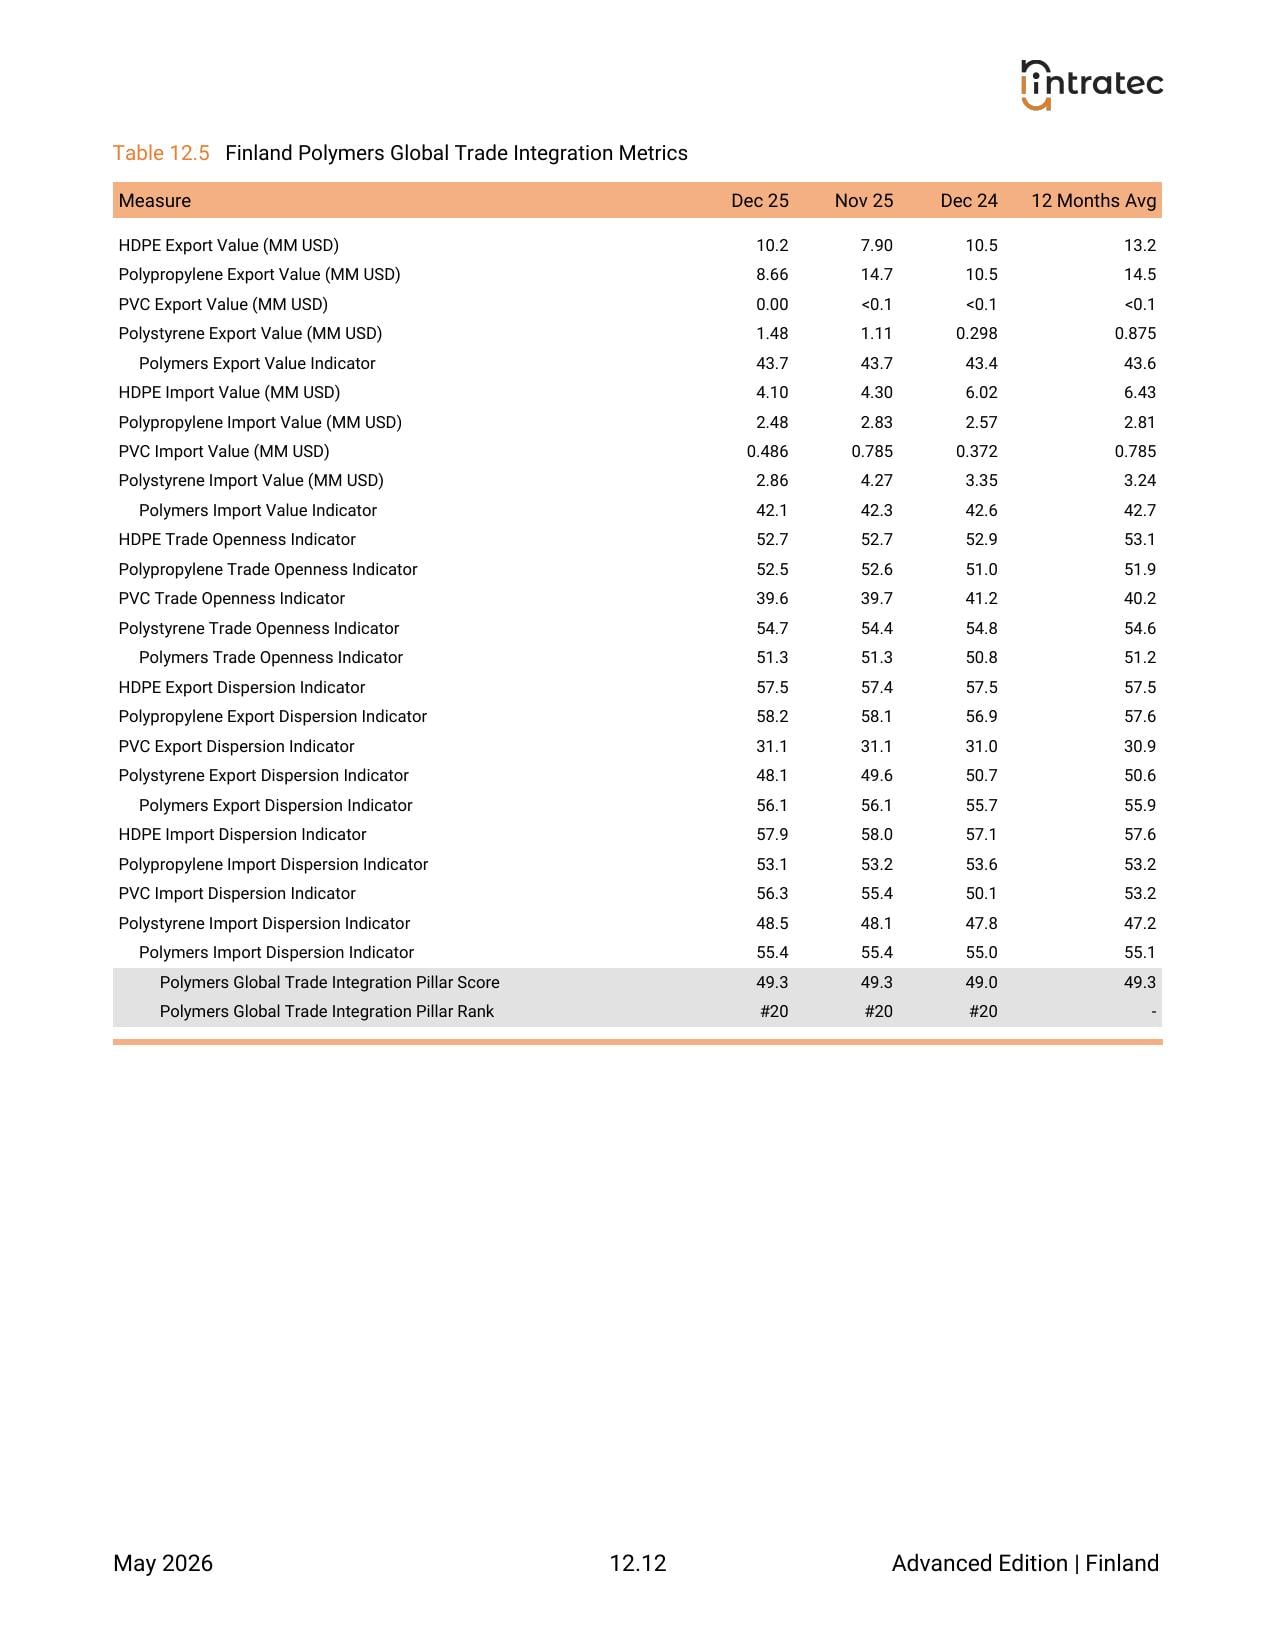
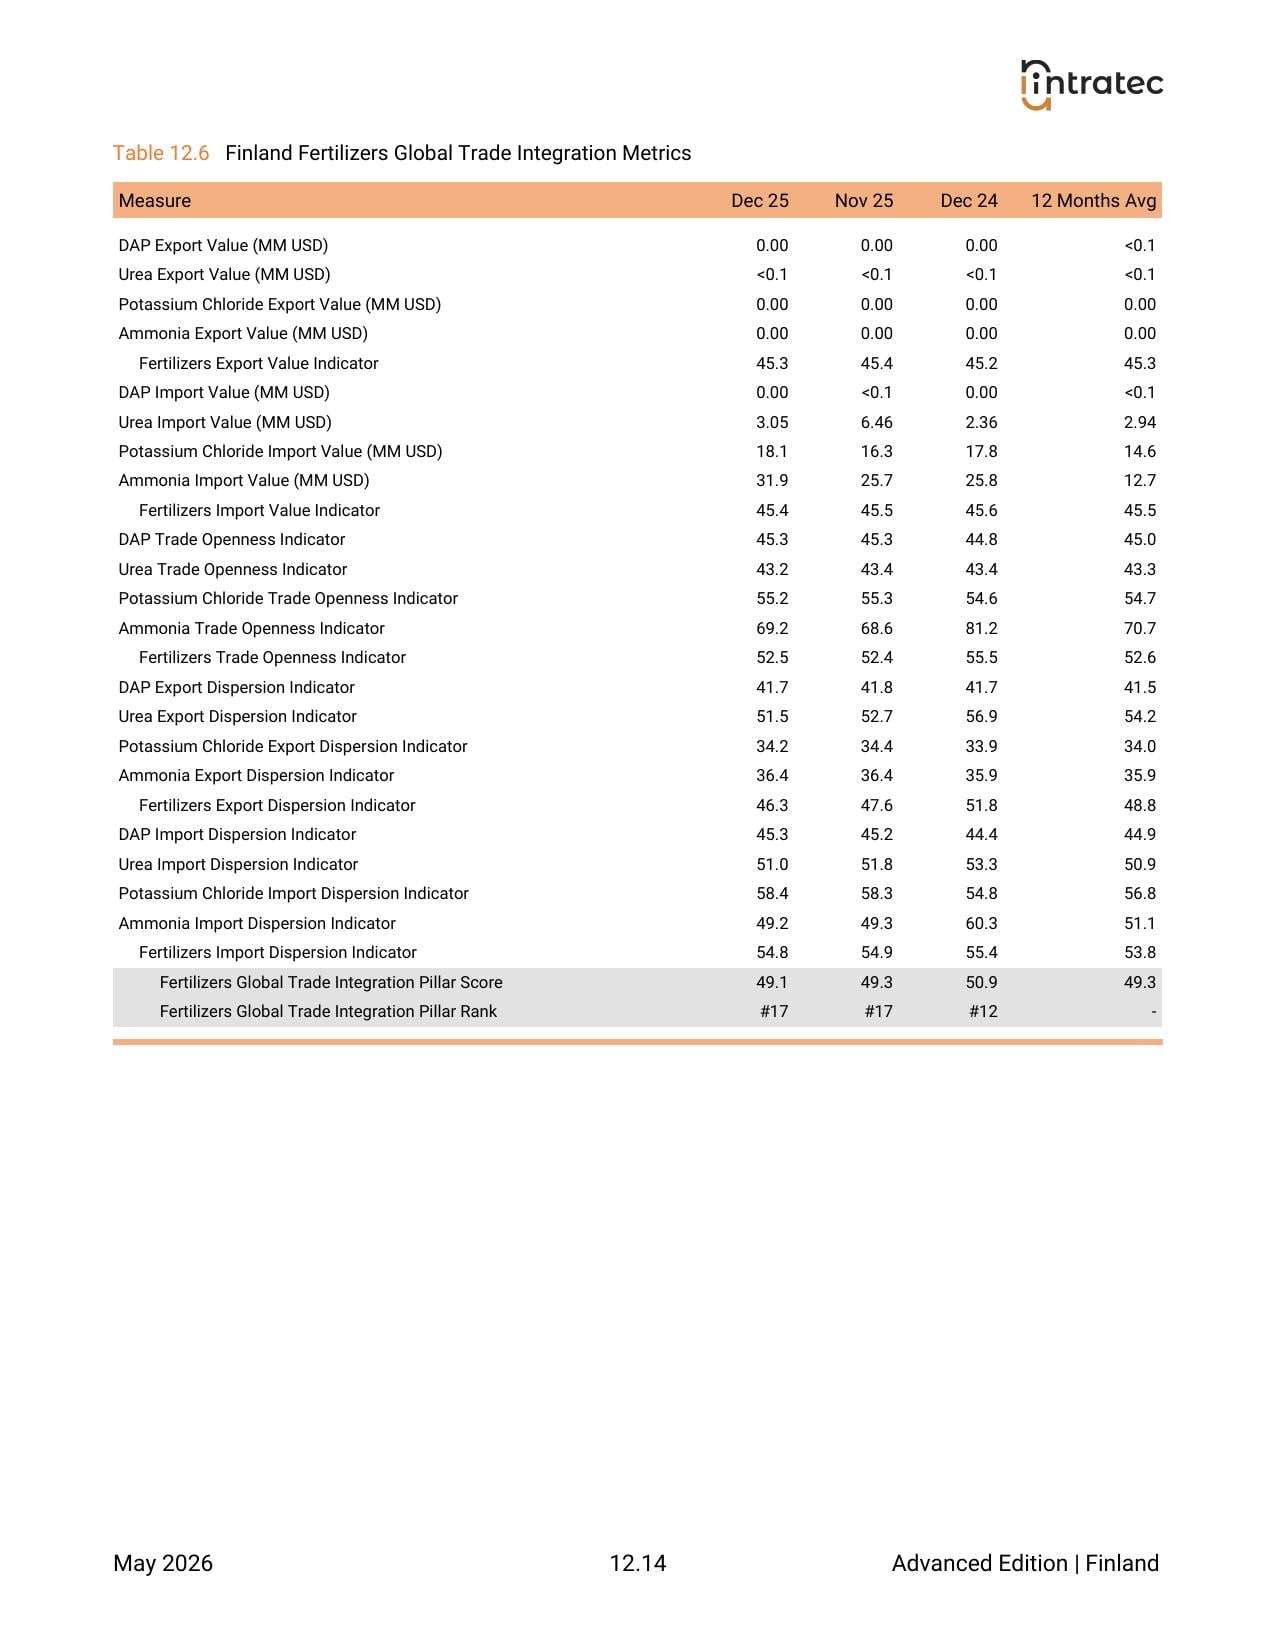
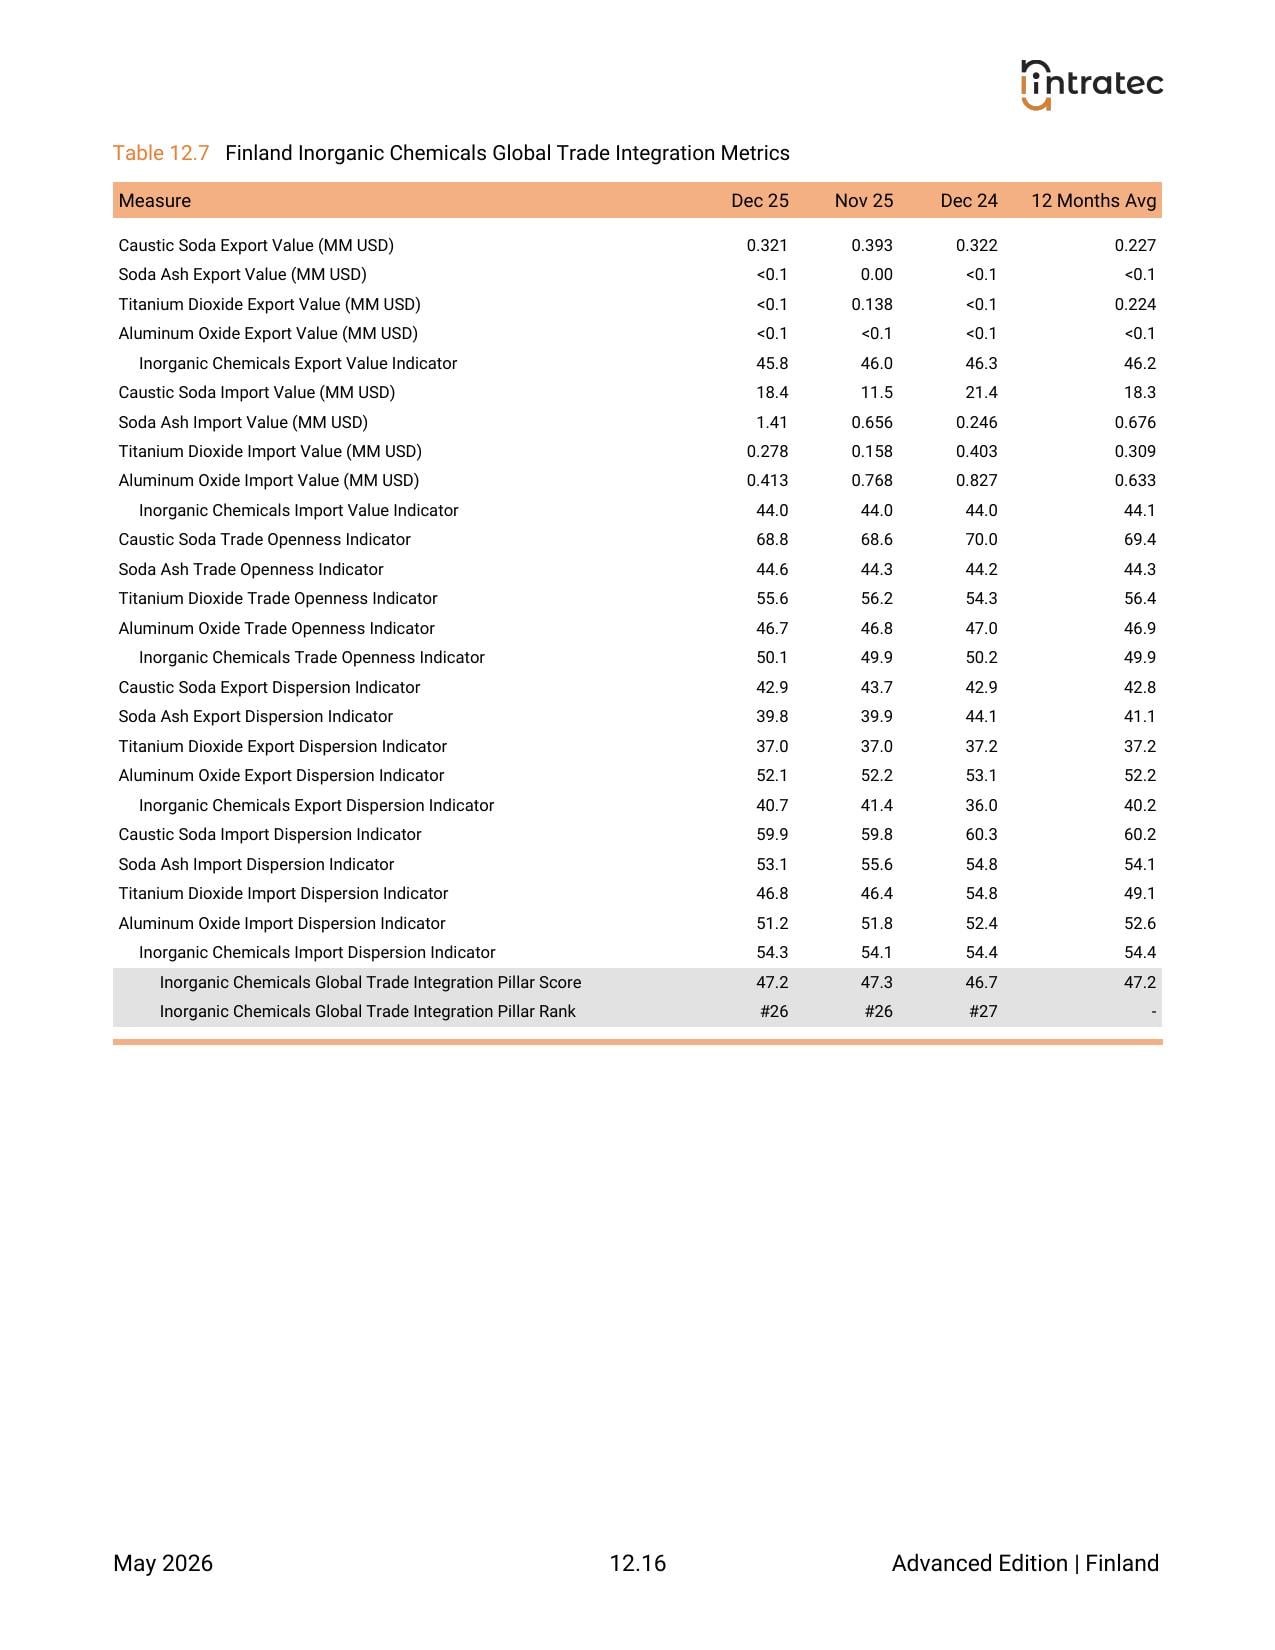
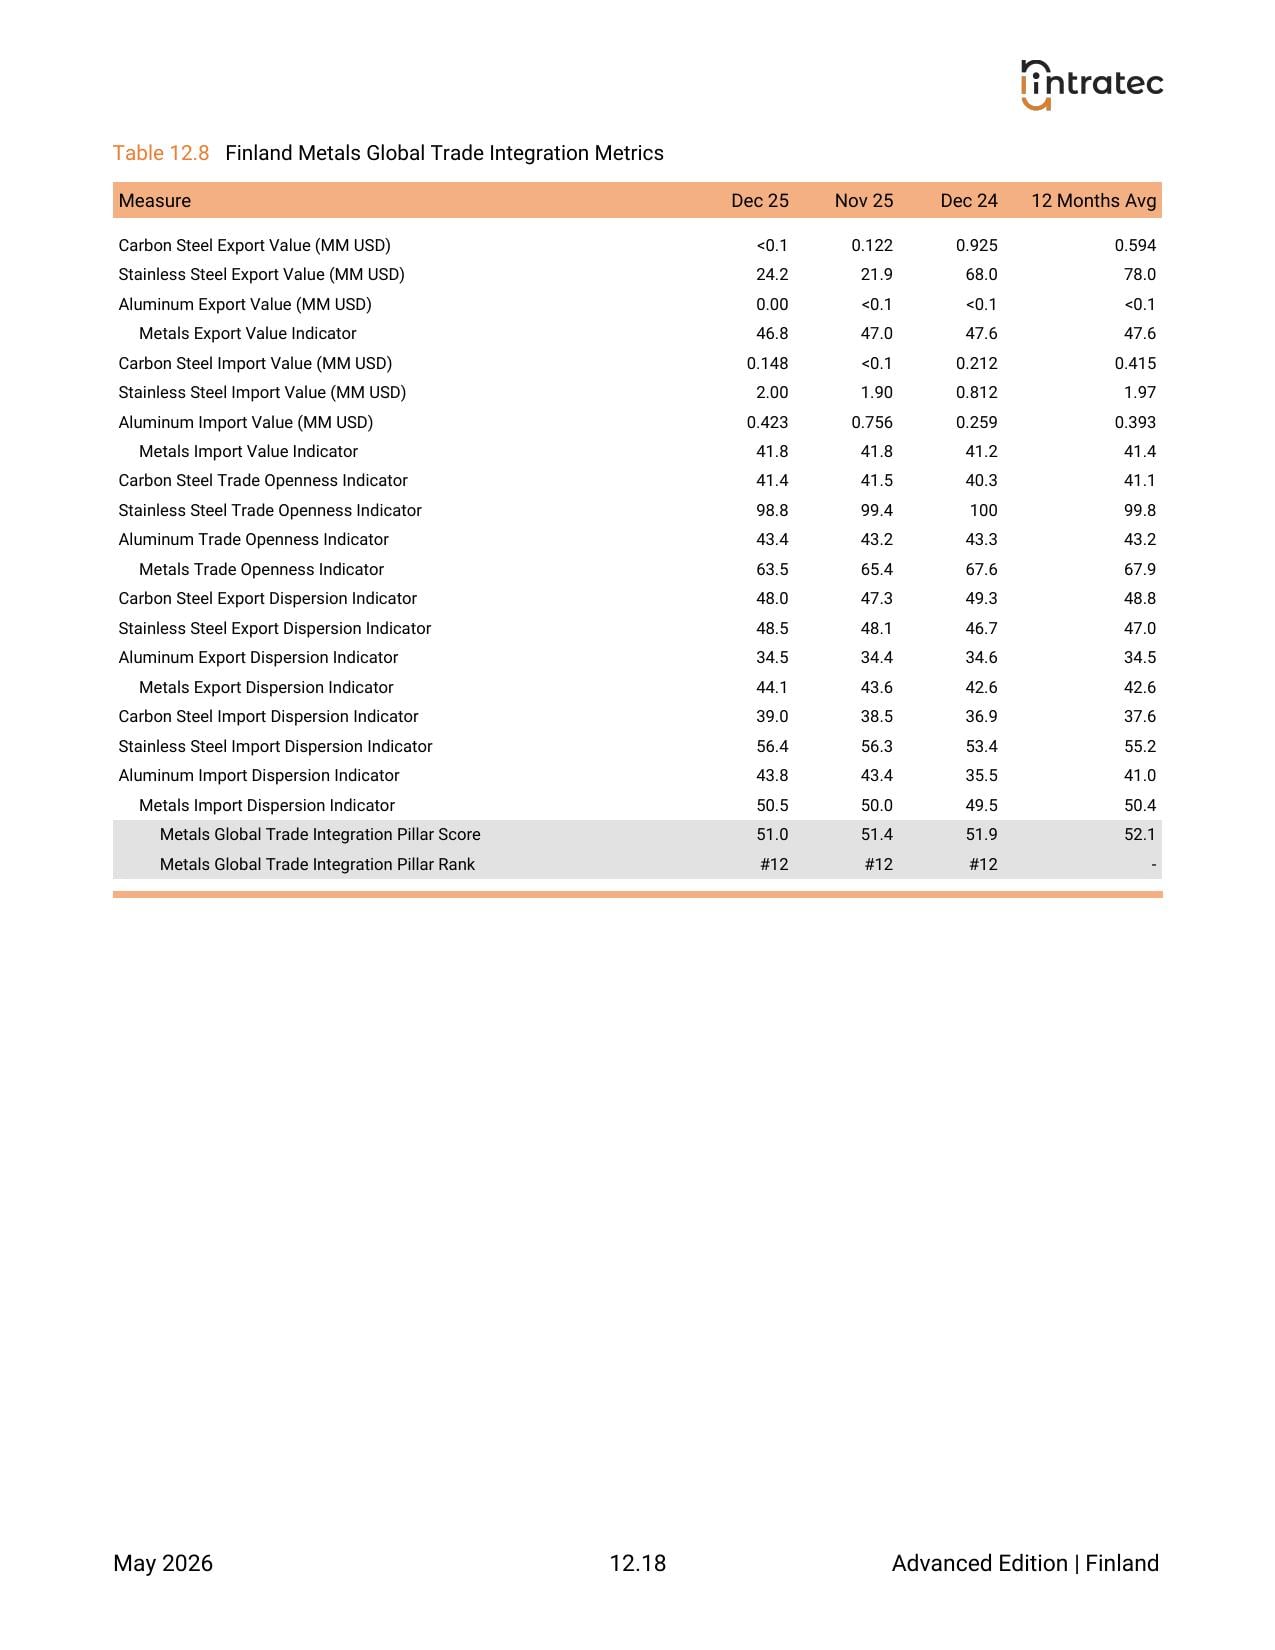
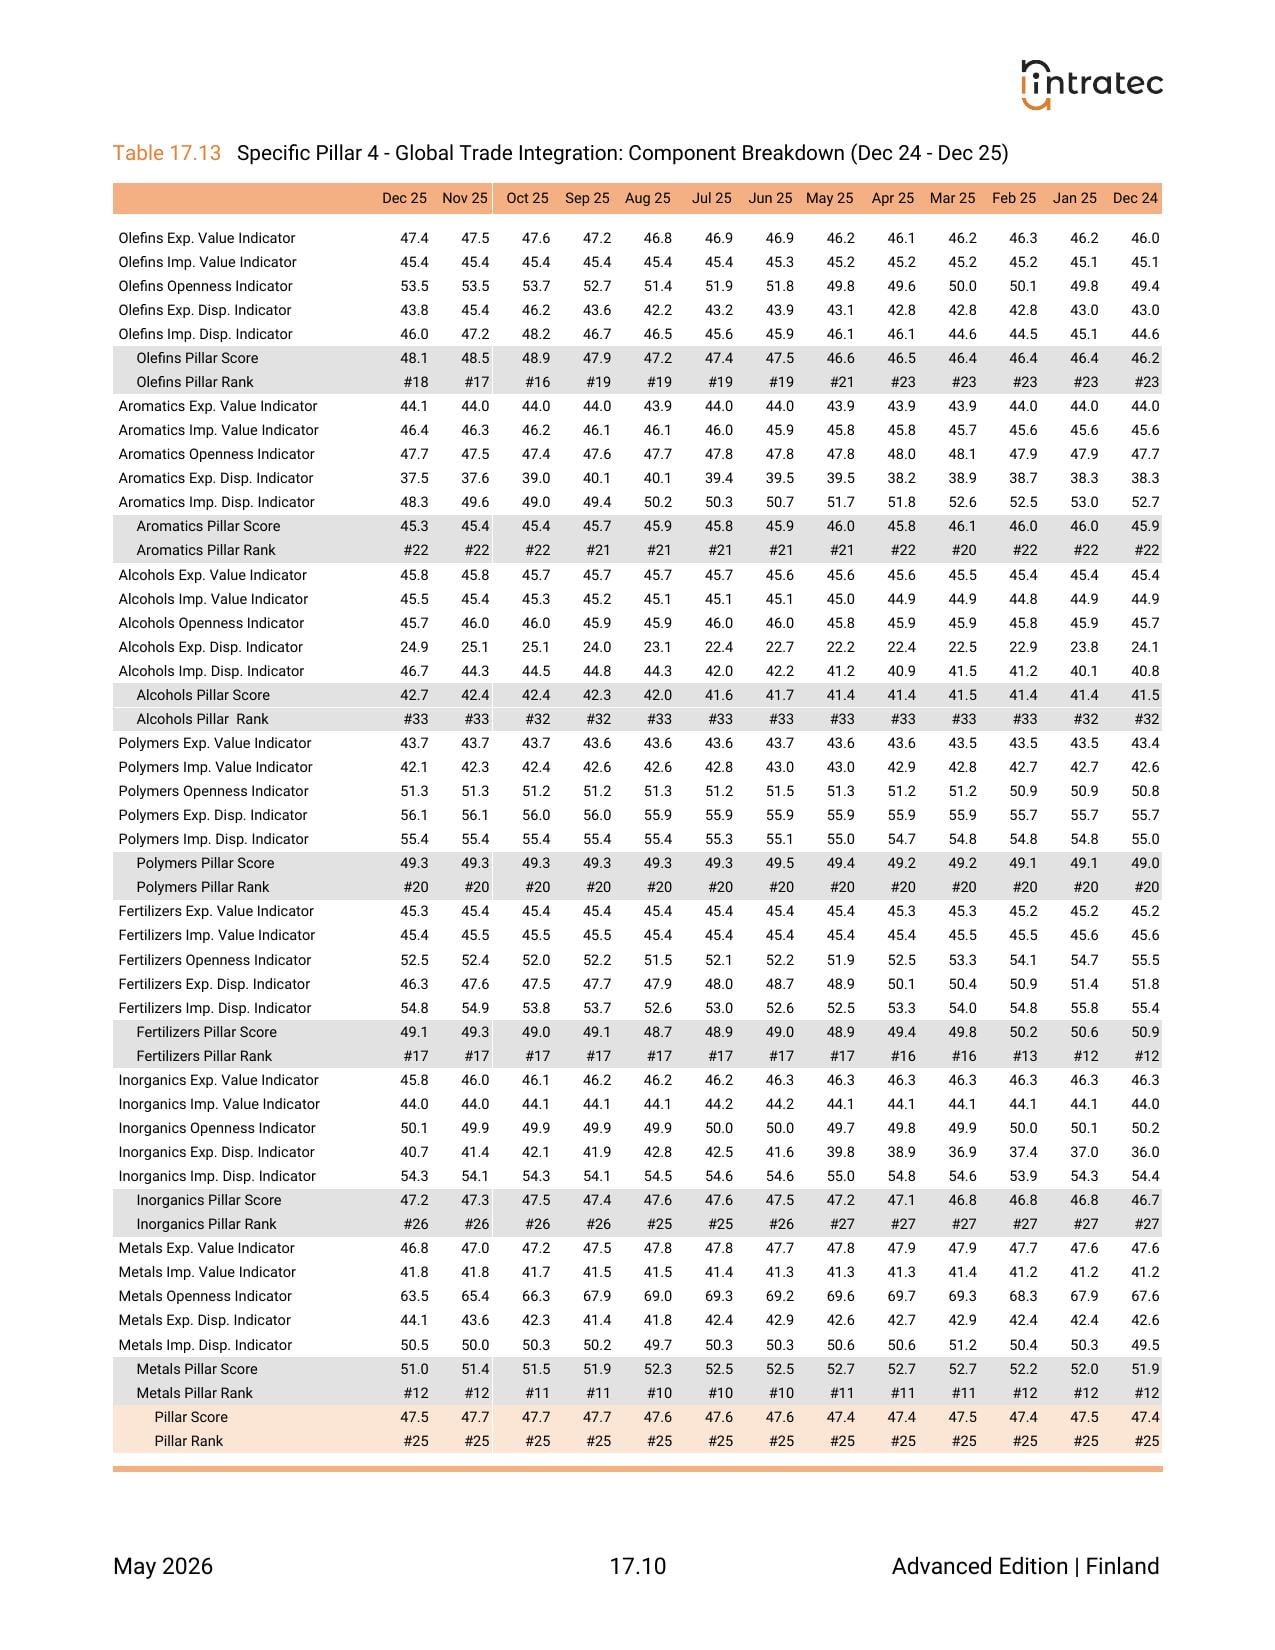
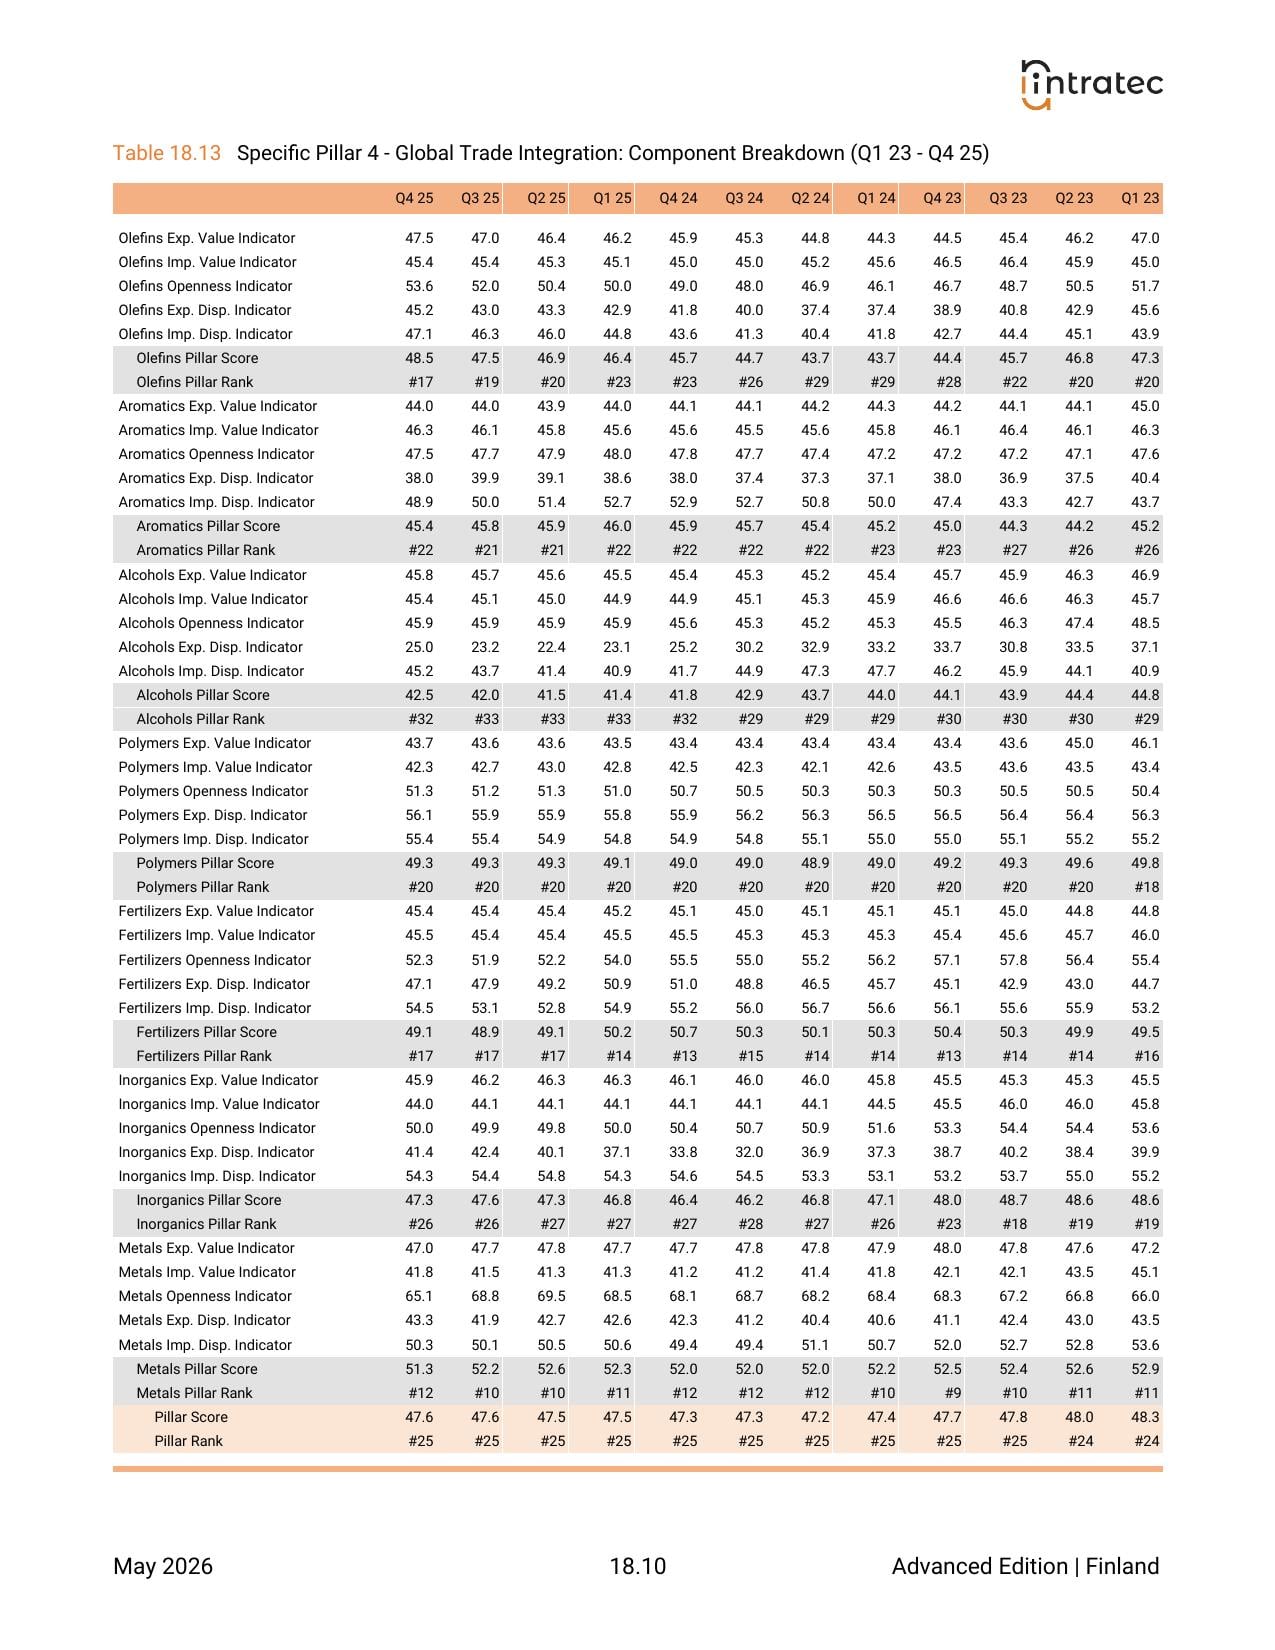
Global Trade Integration - Pillar Breakdown
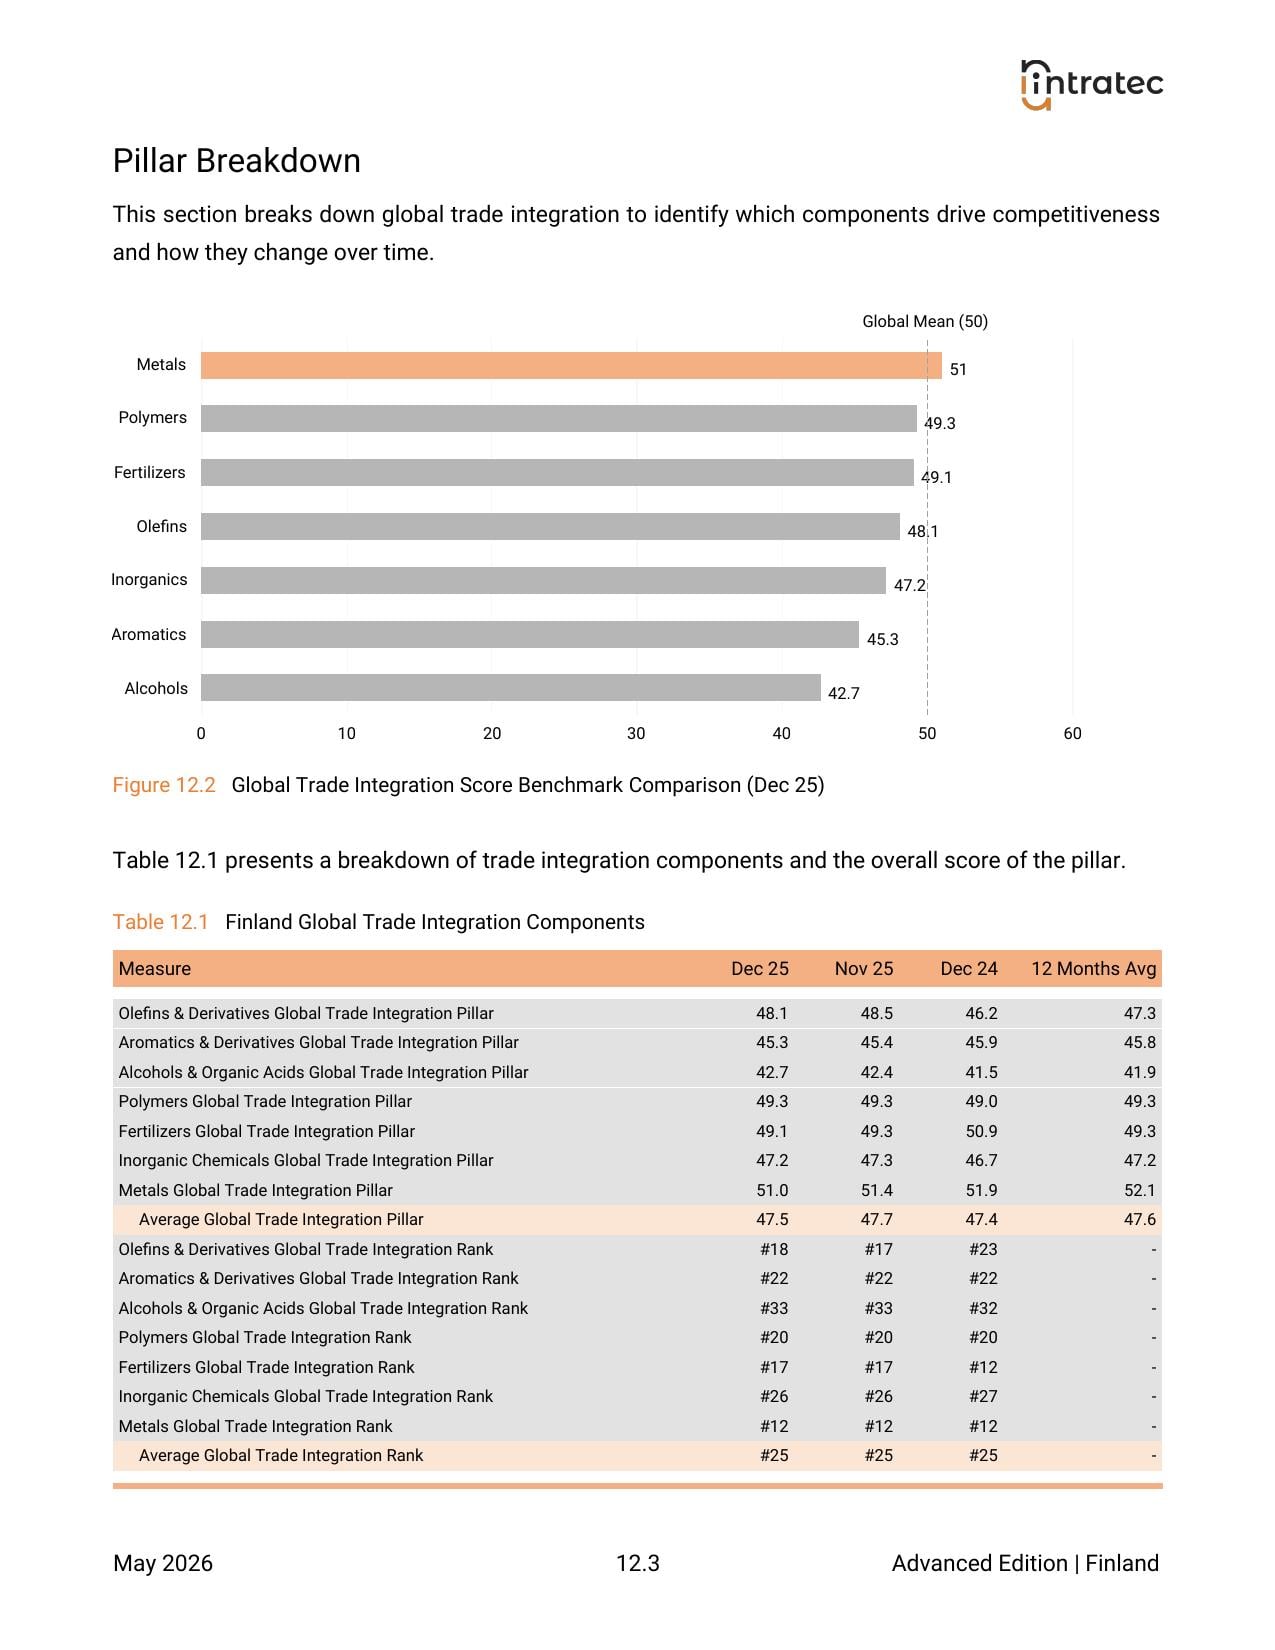
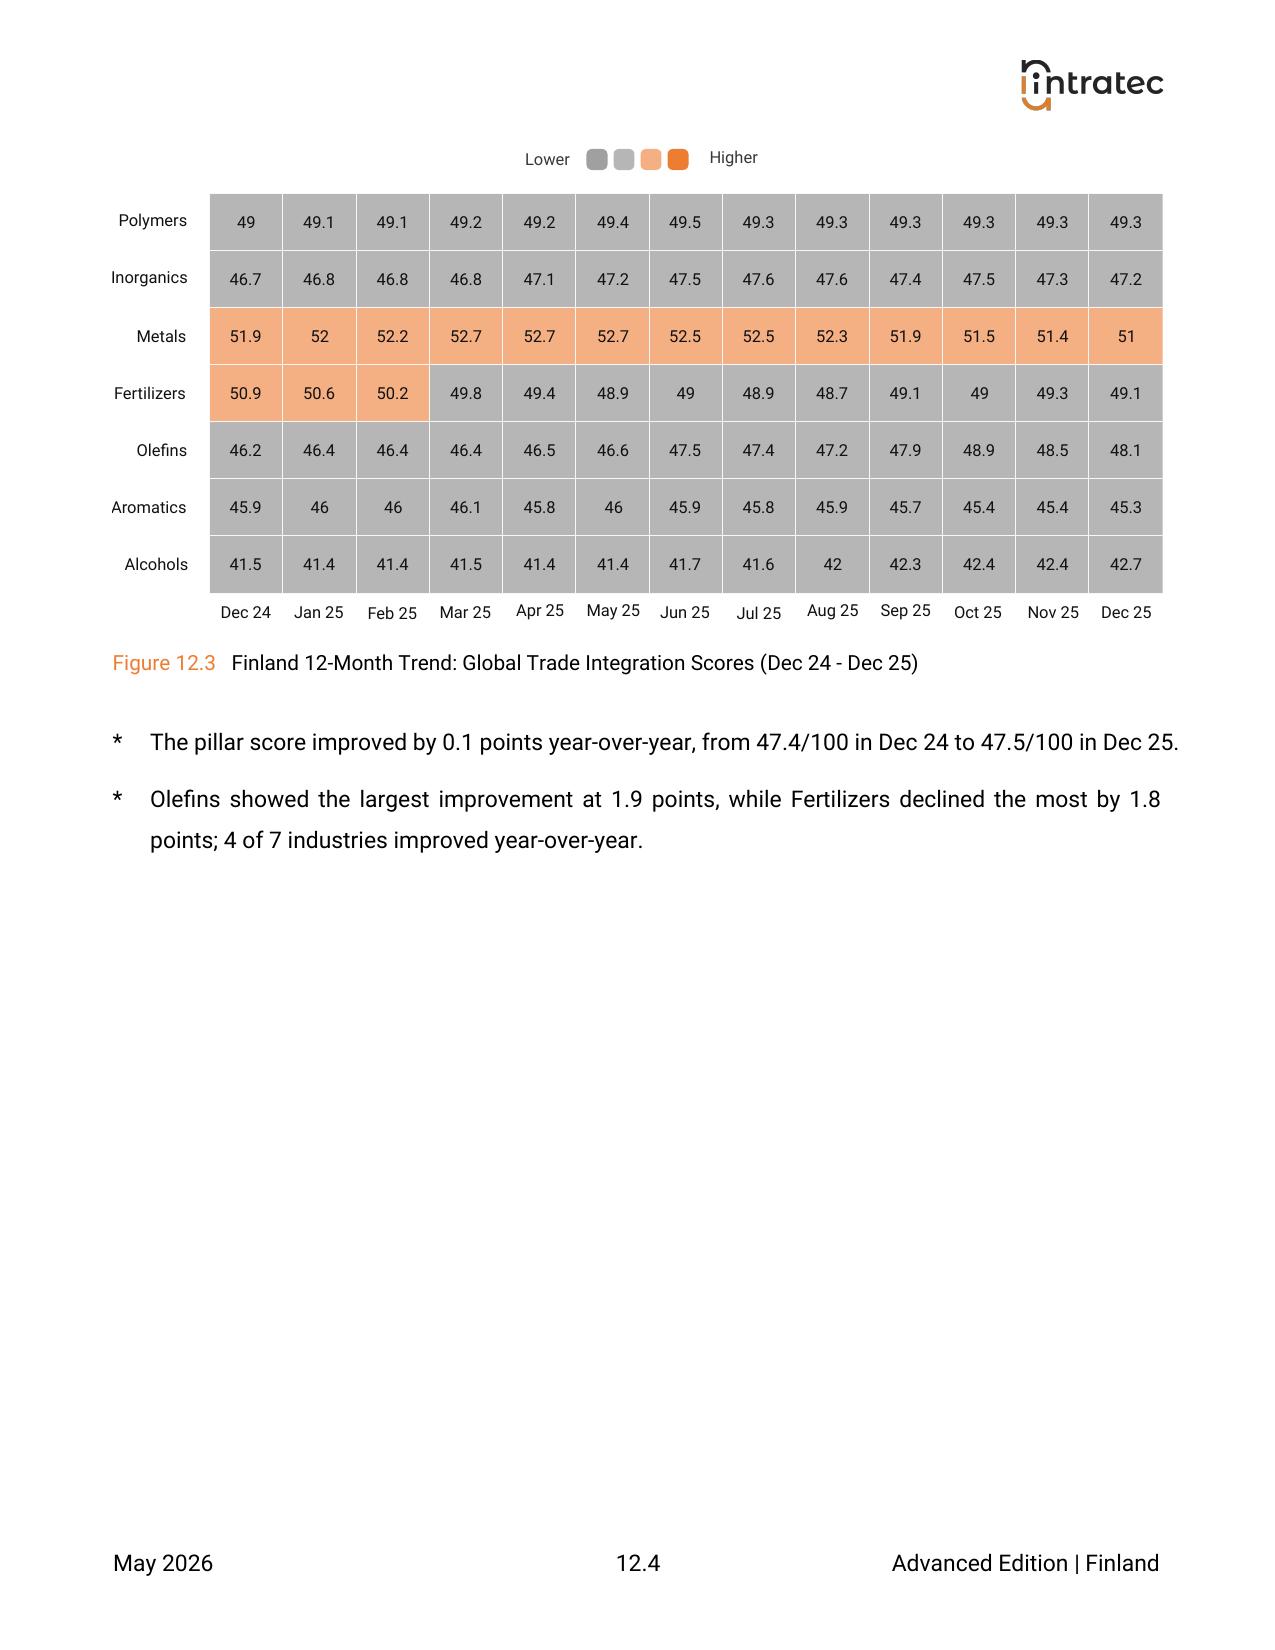
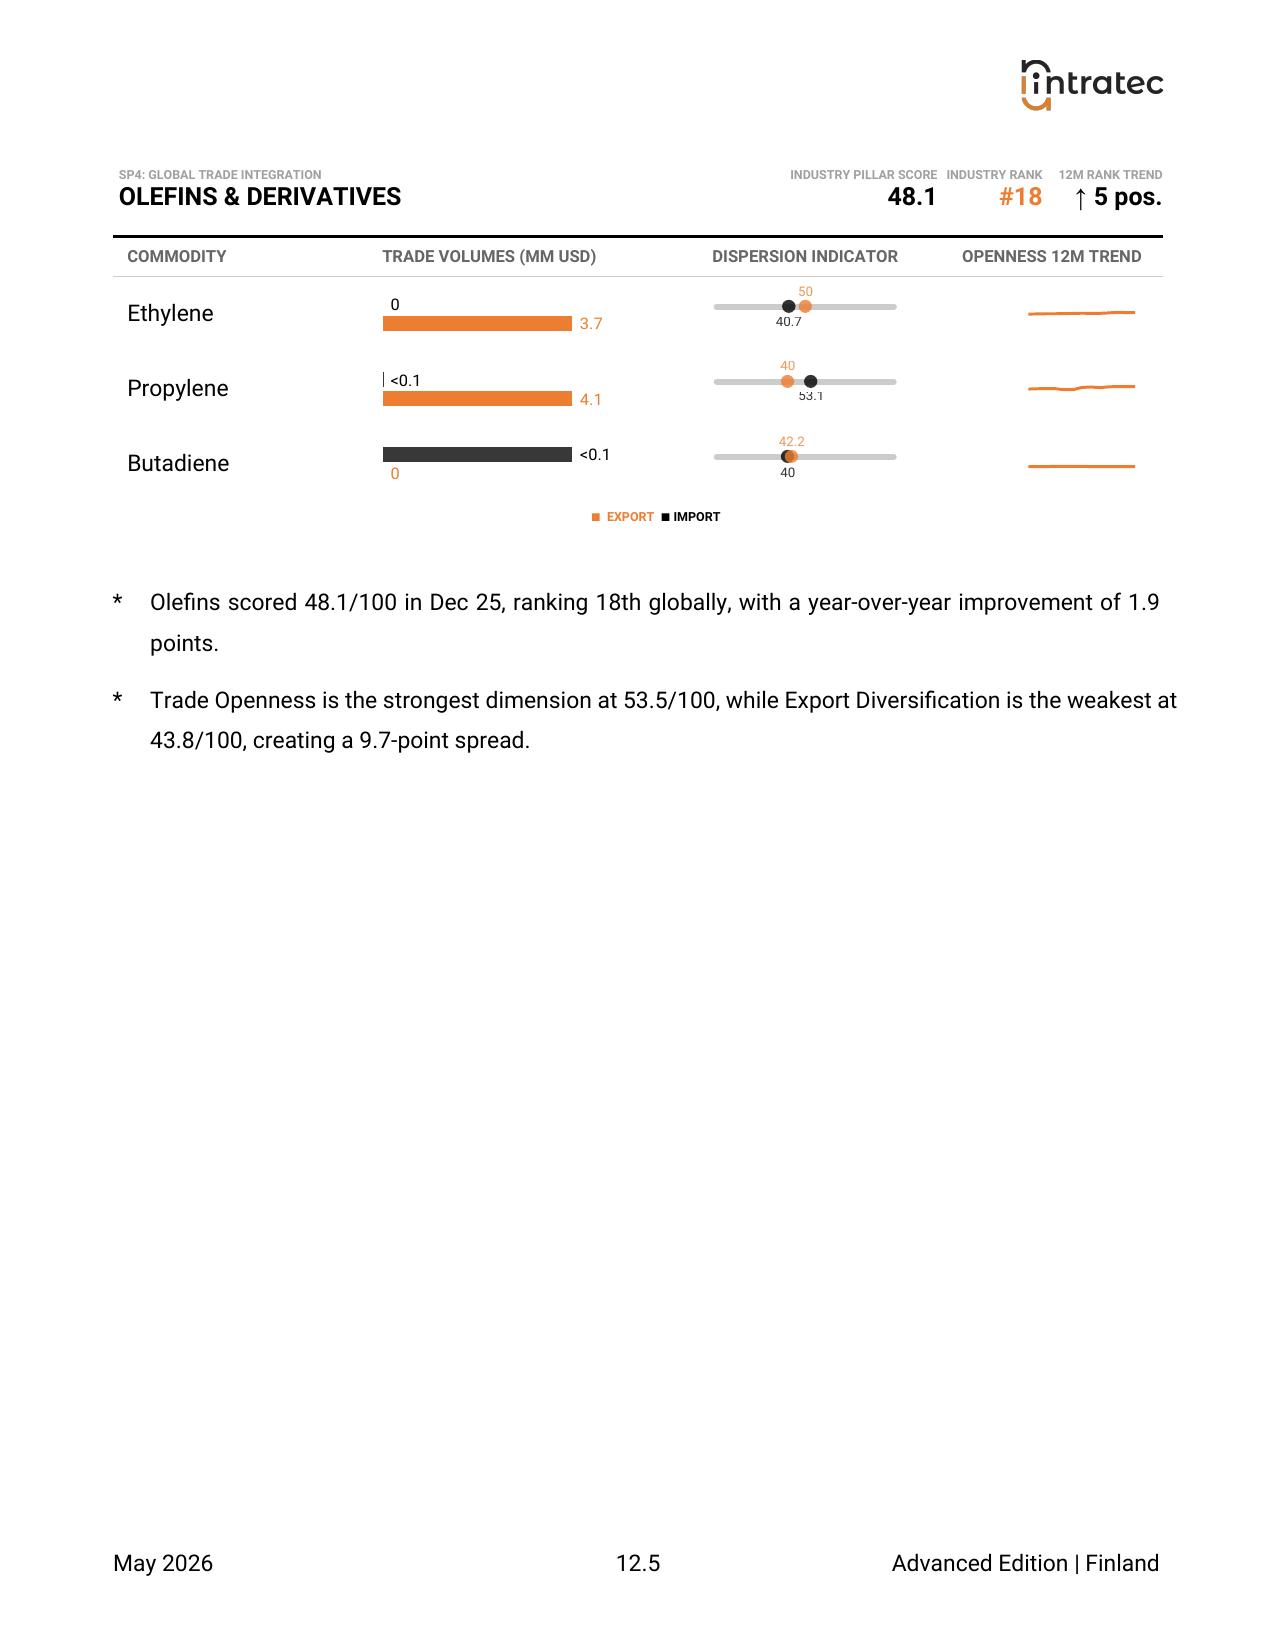
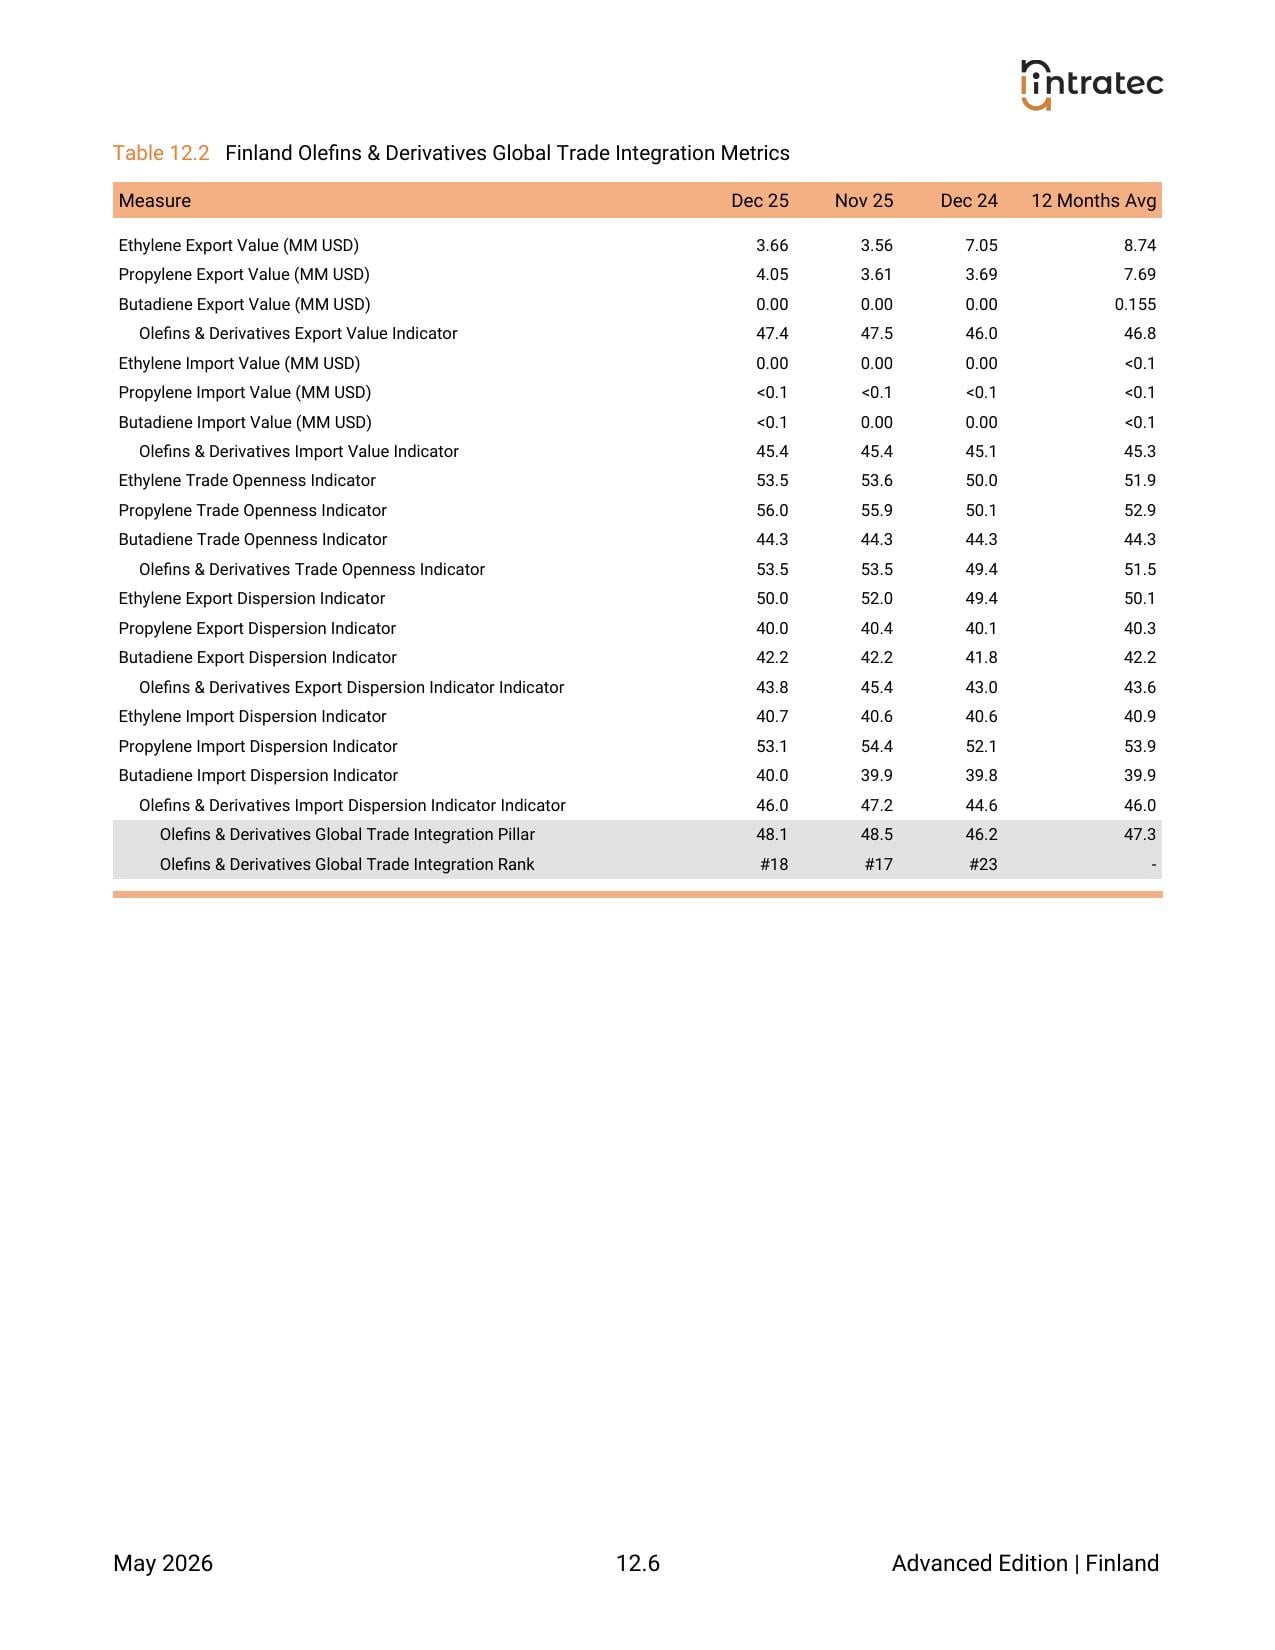
For every commodity in the program: export value, import value, trade openness (trade relative to Gross Domestic Product), and how concentrated or diversified the country's trading partners are on both the export and import sides.
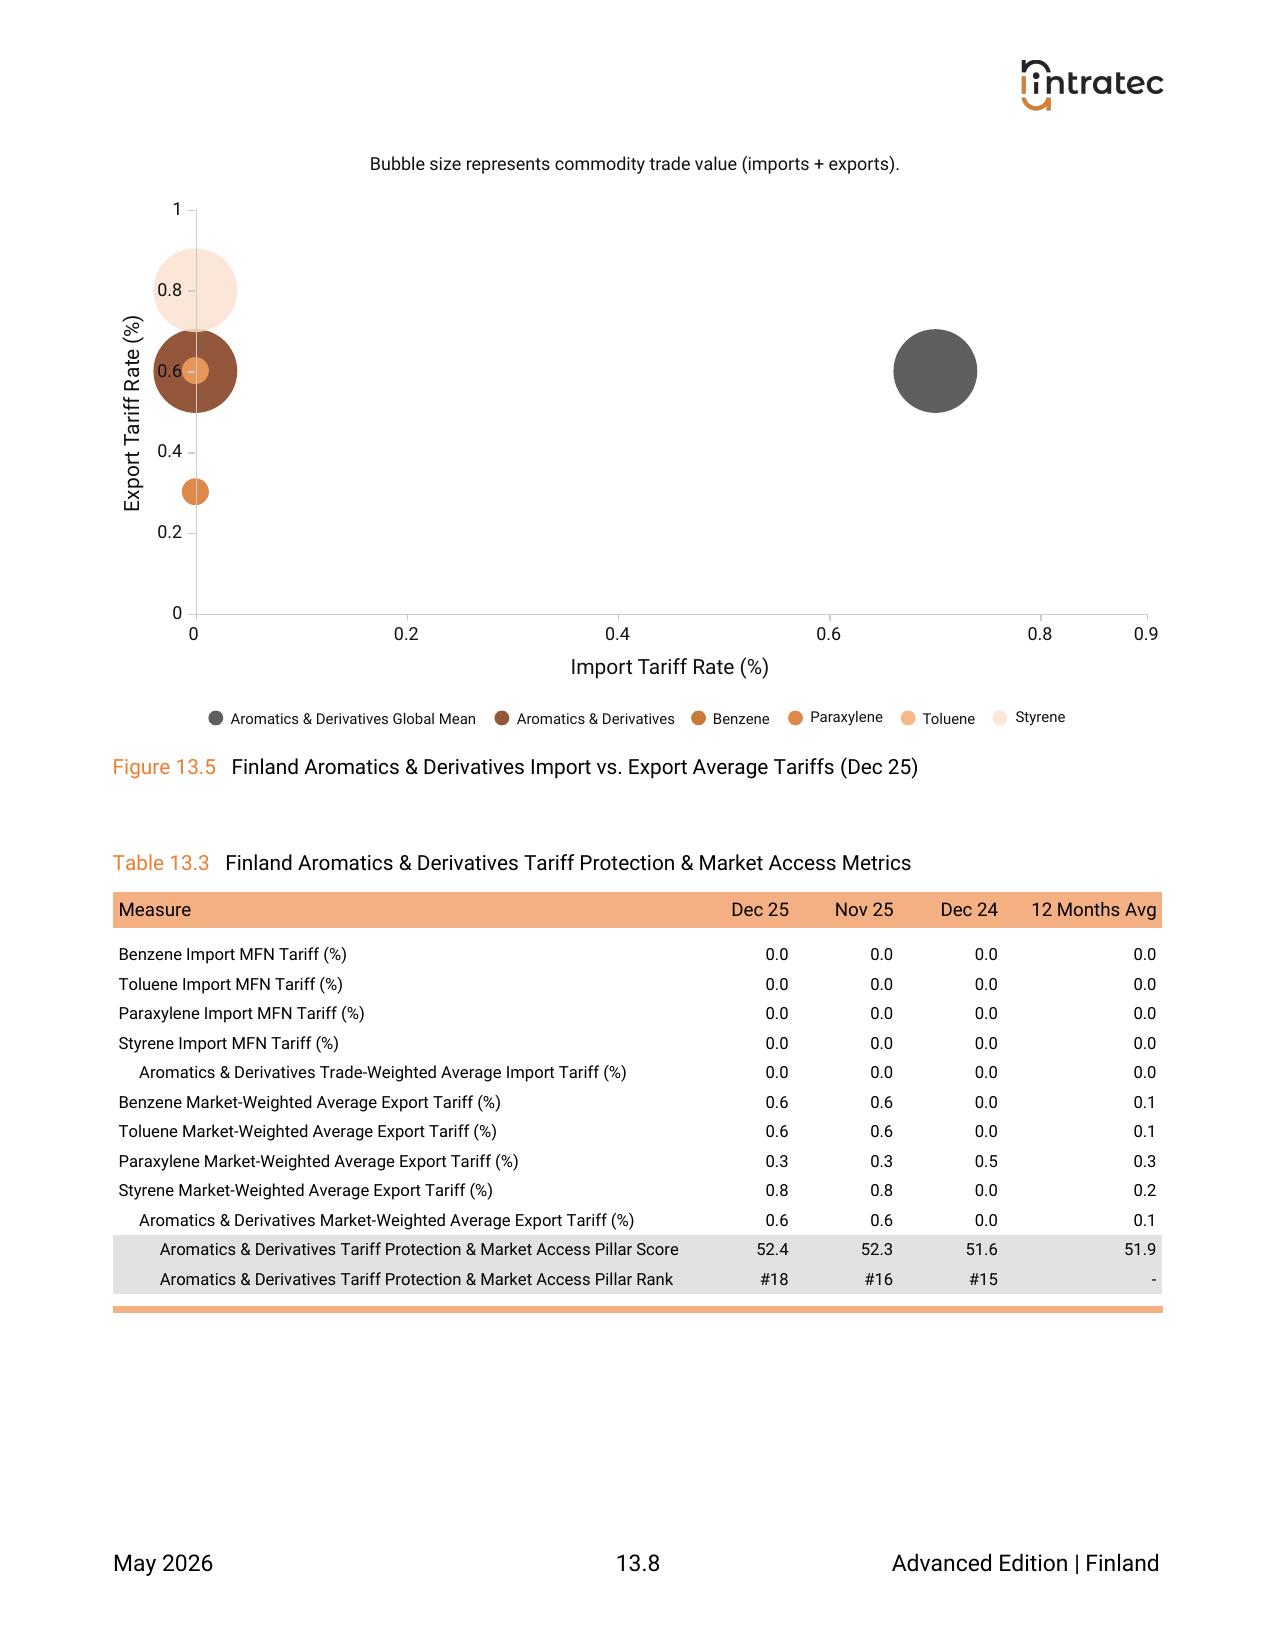
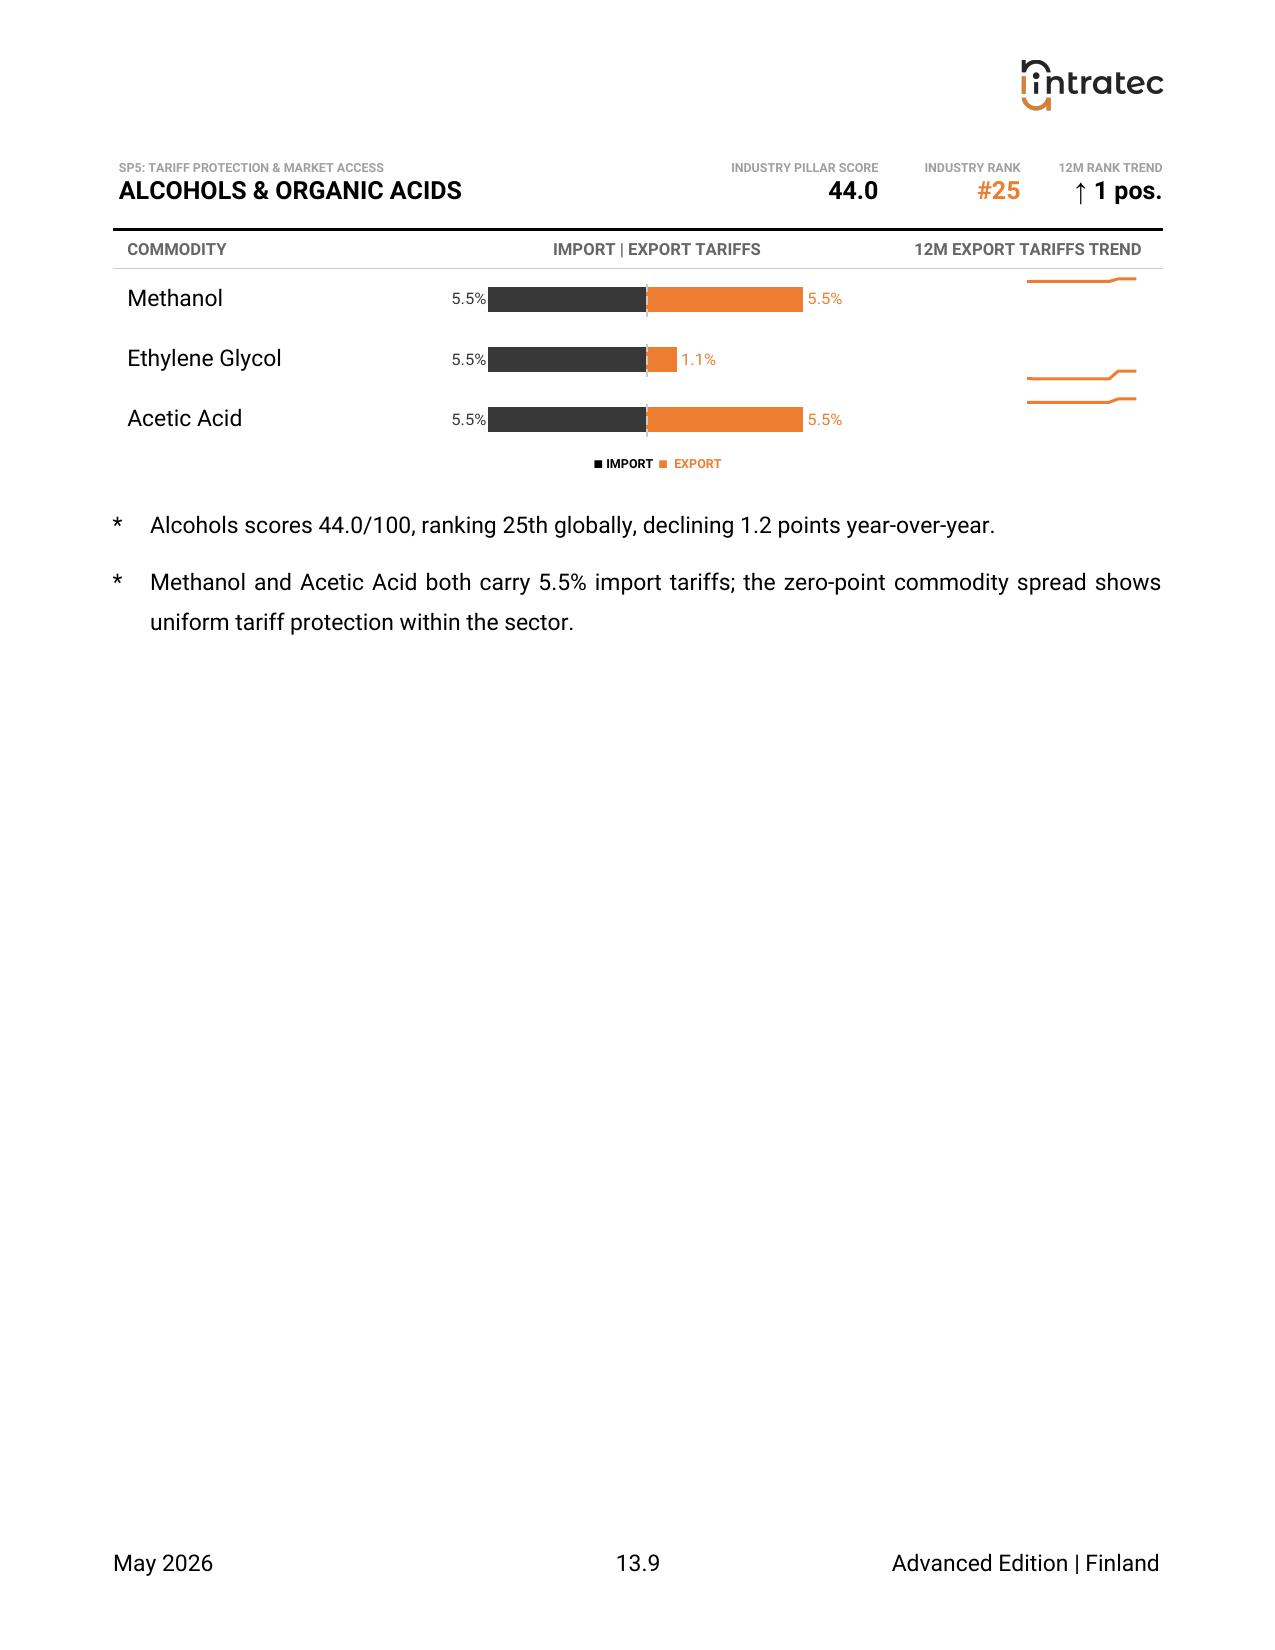
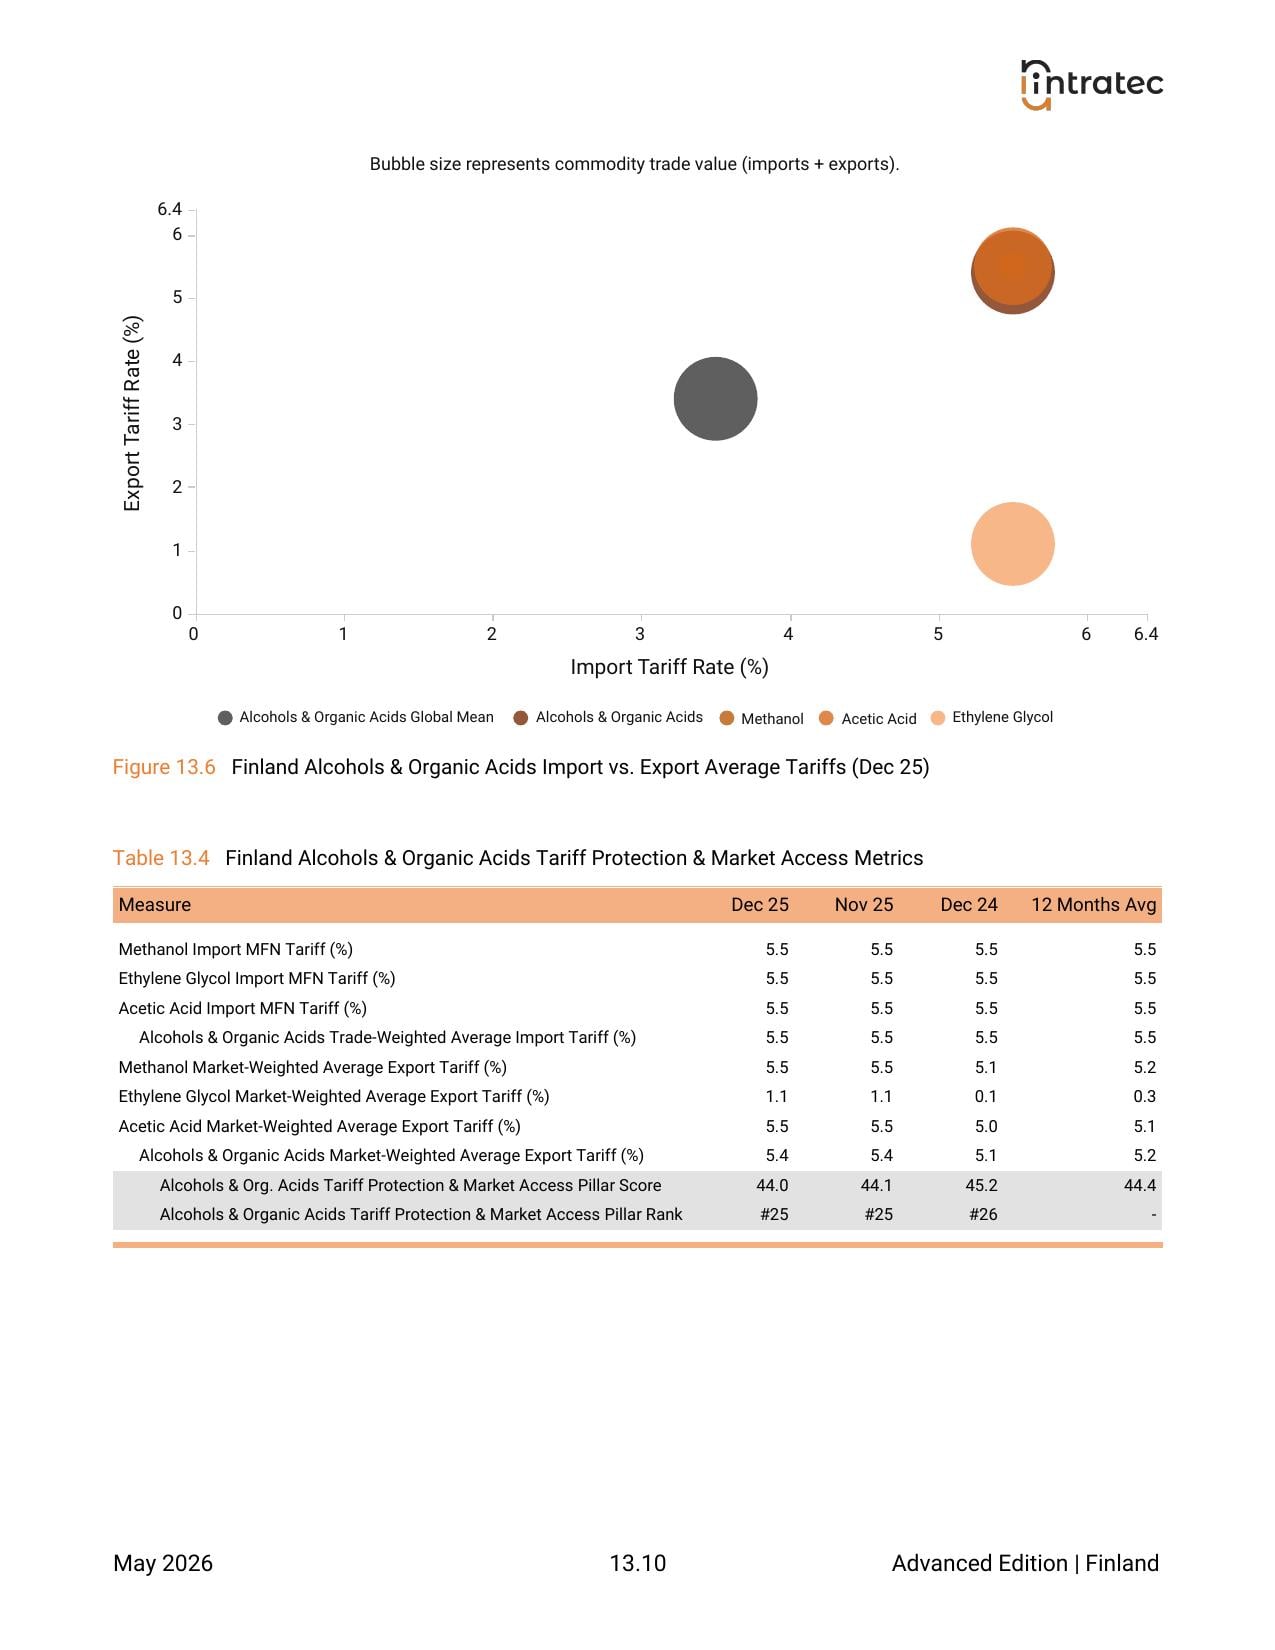
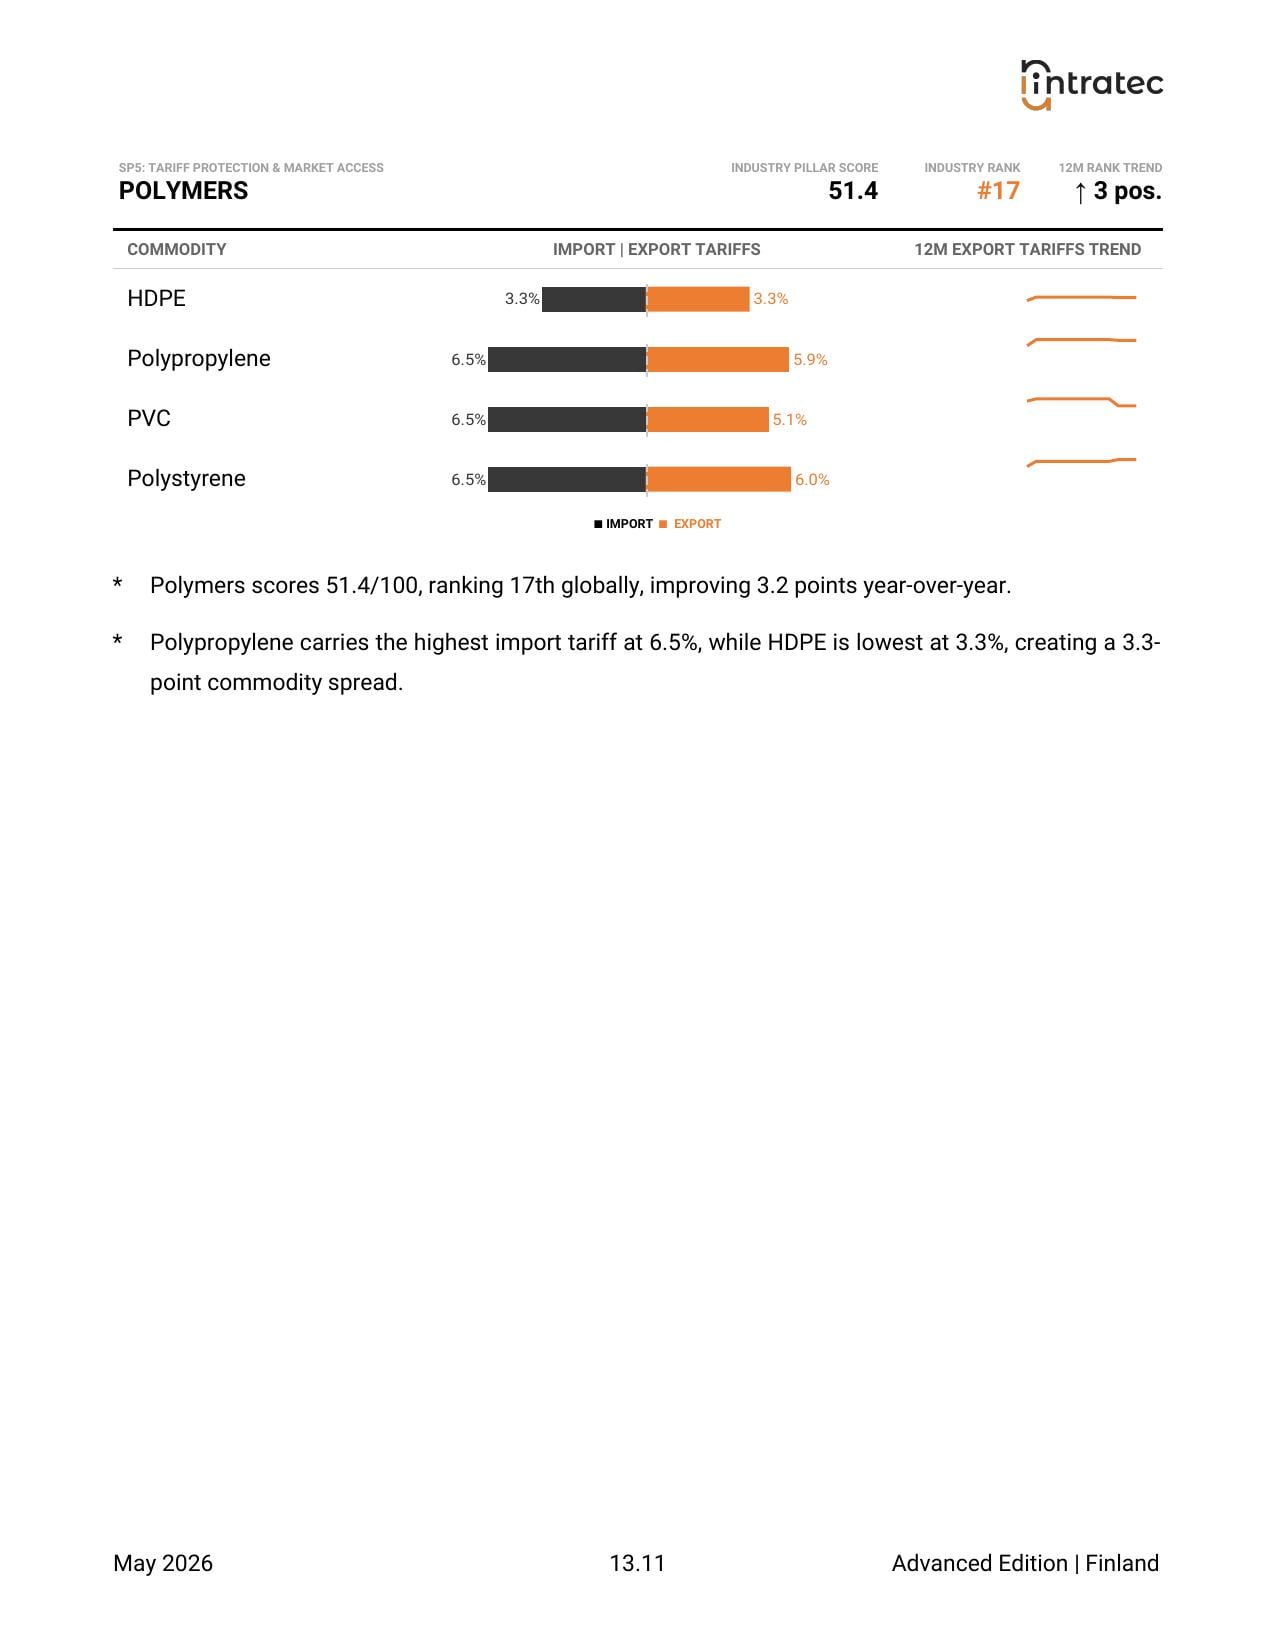
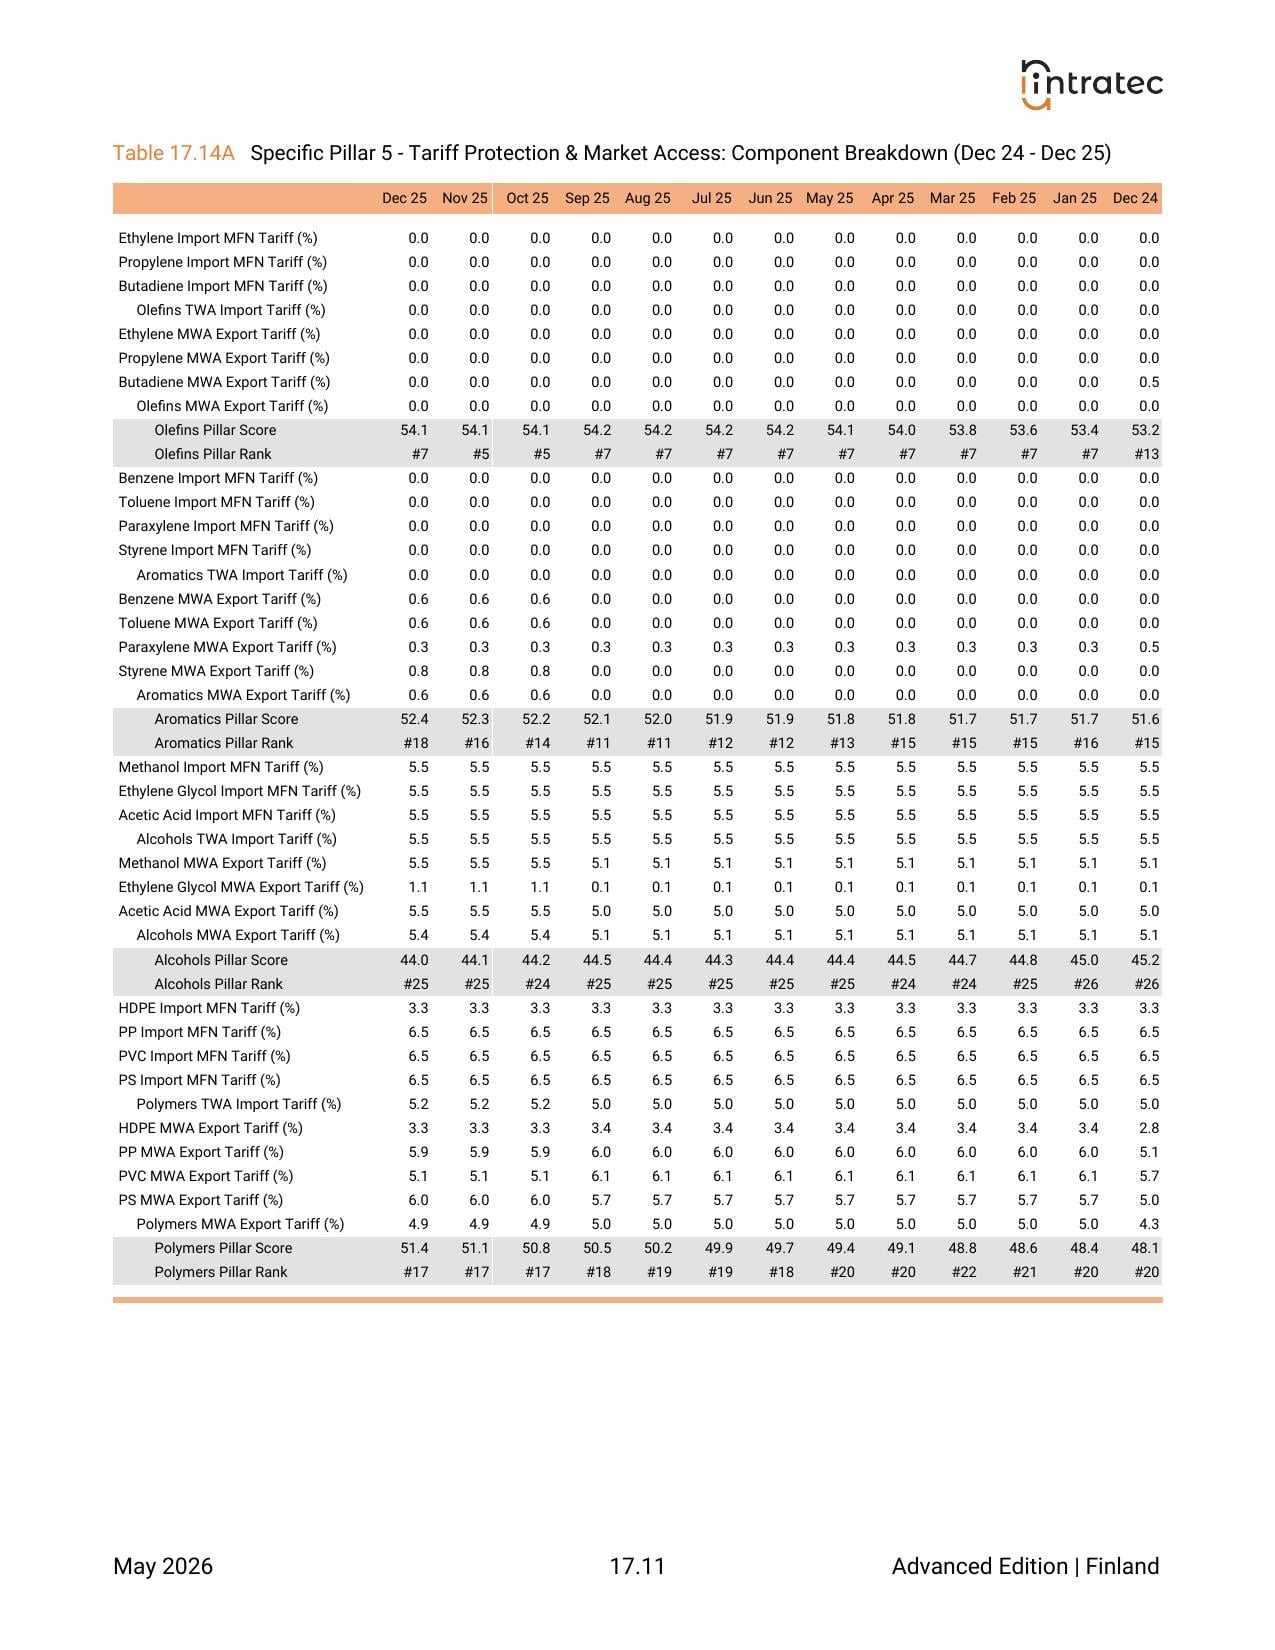
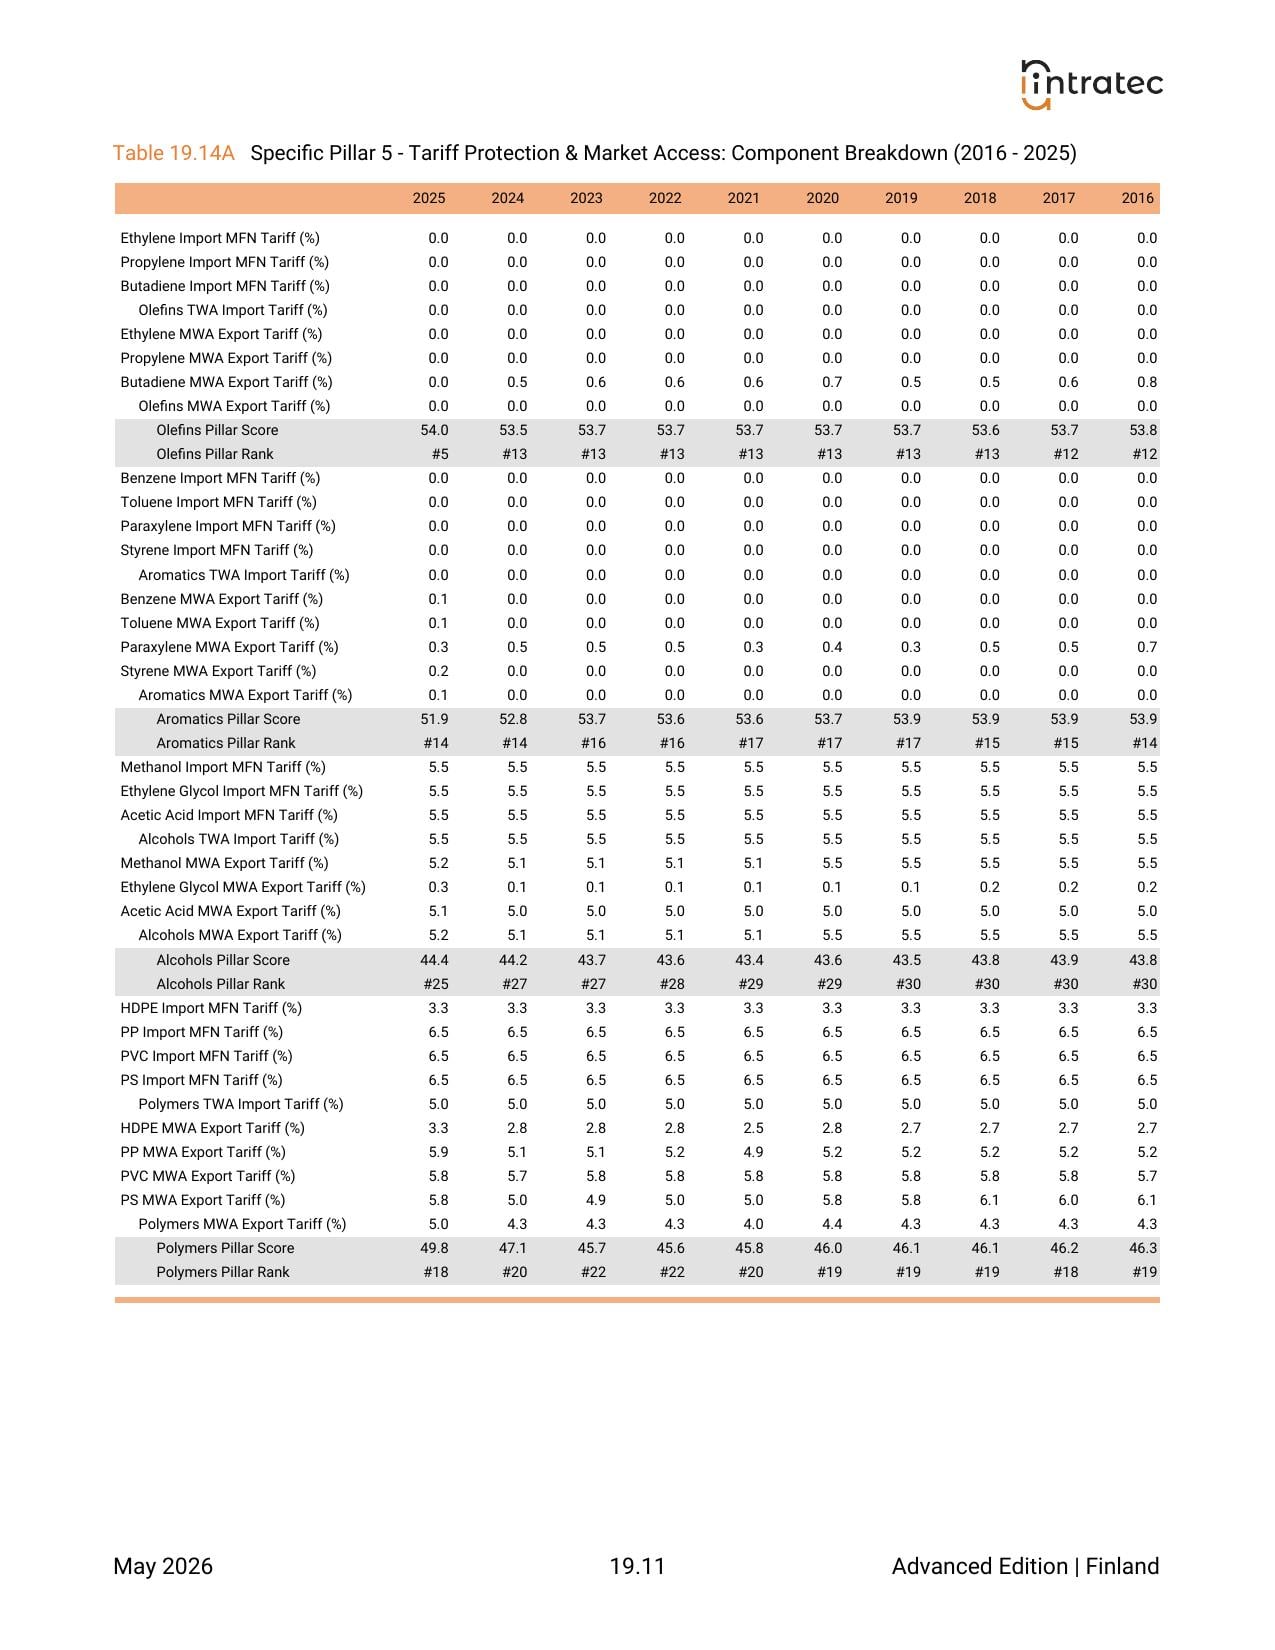
Tariff Protection & Market Access - Country Performance
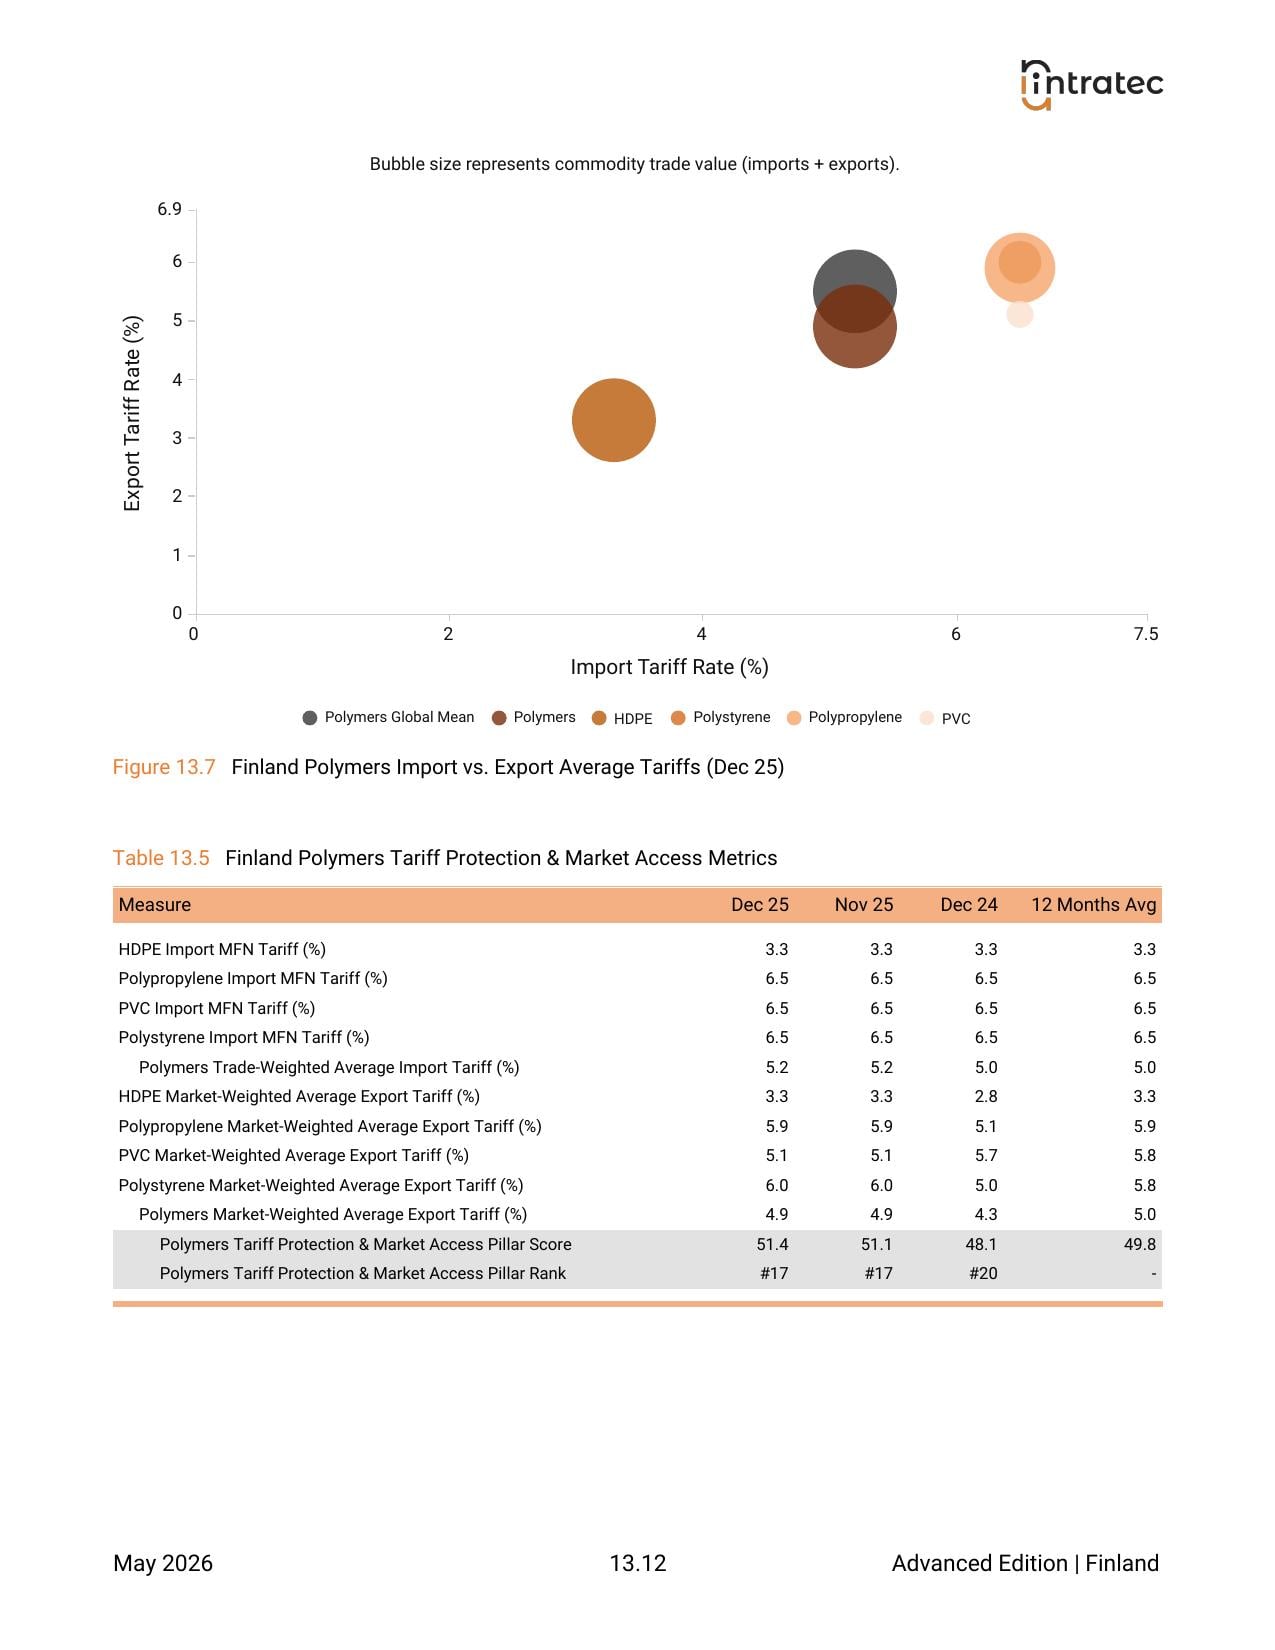
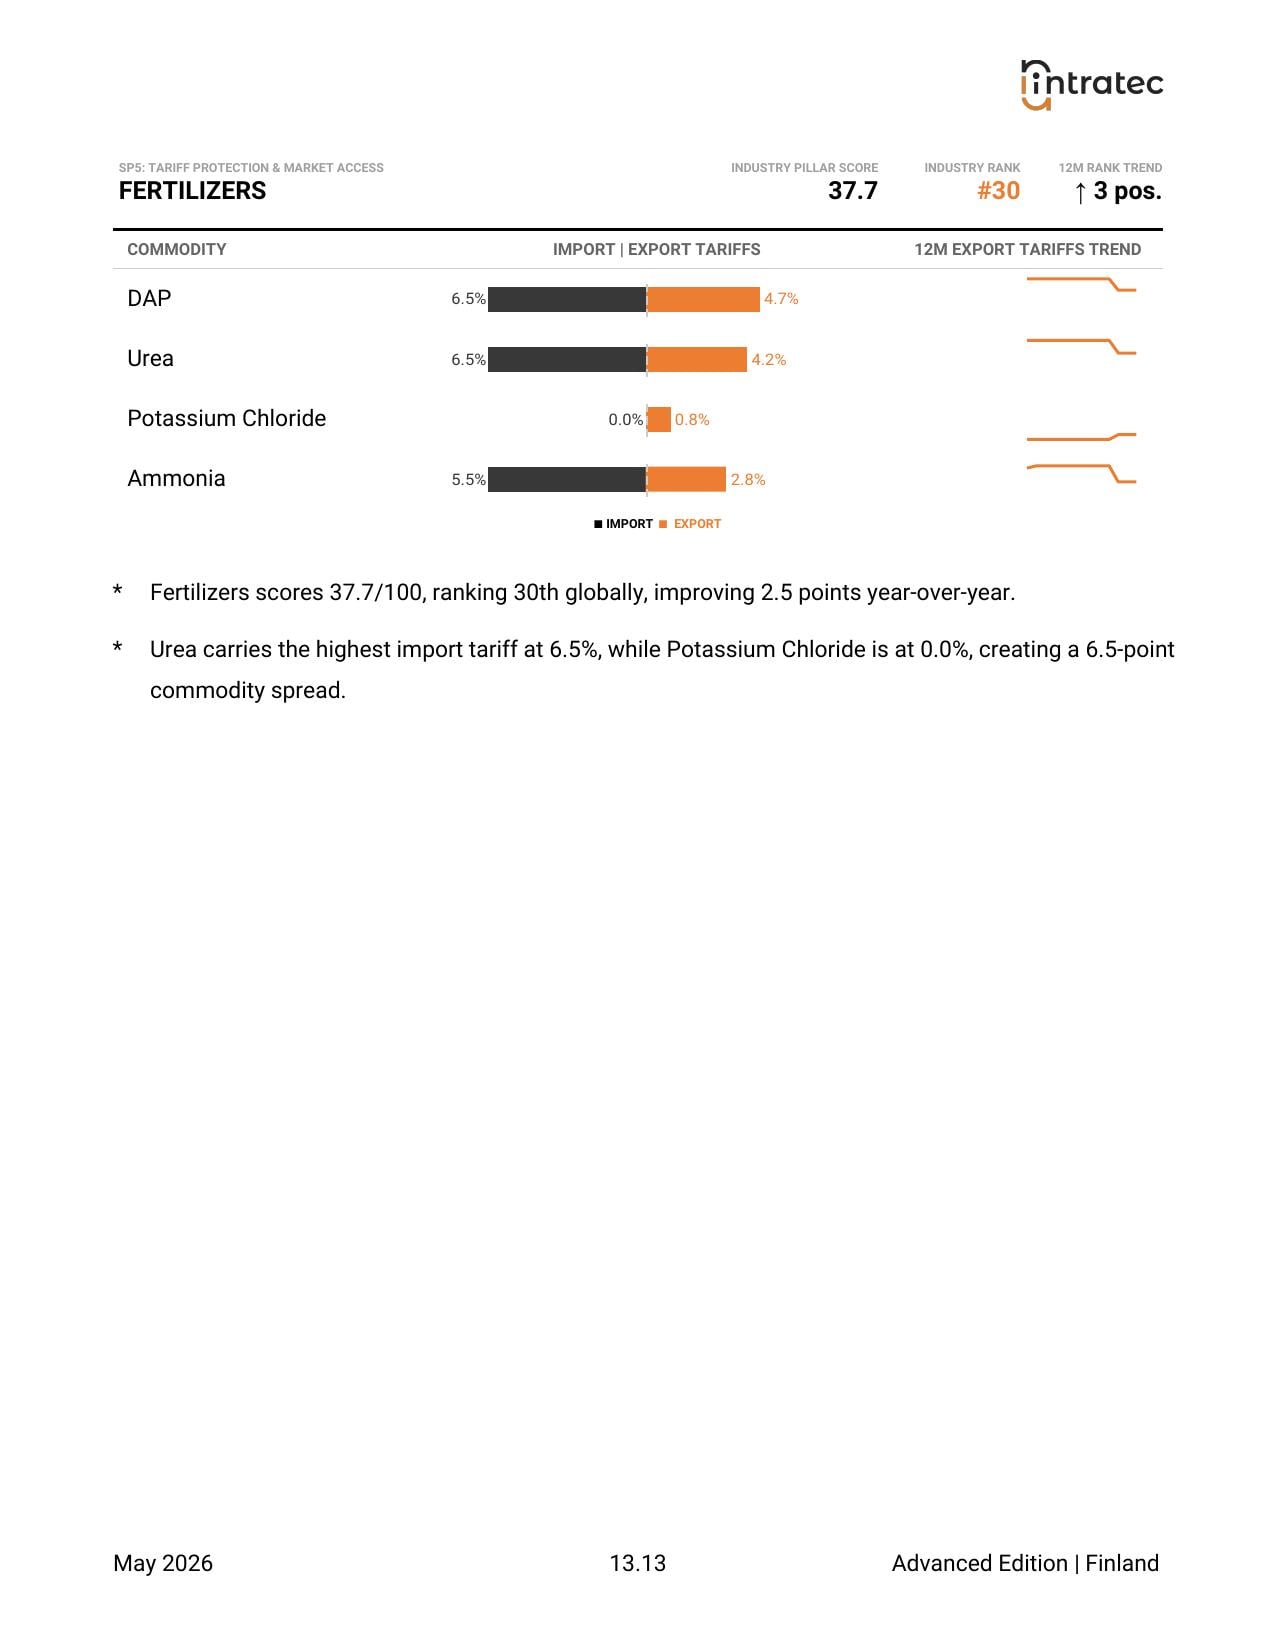
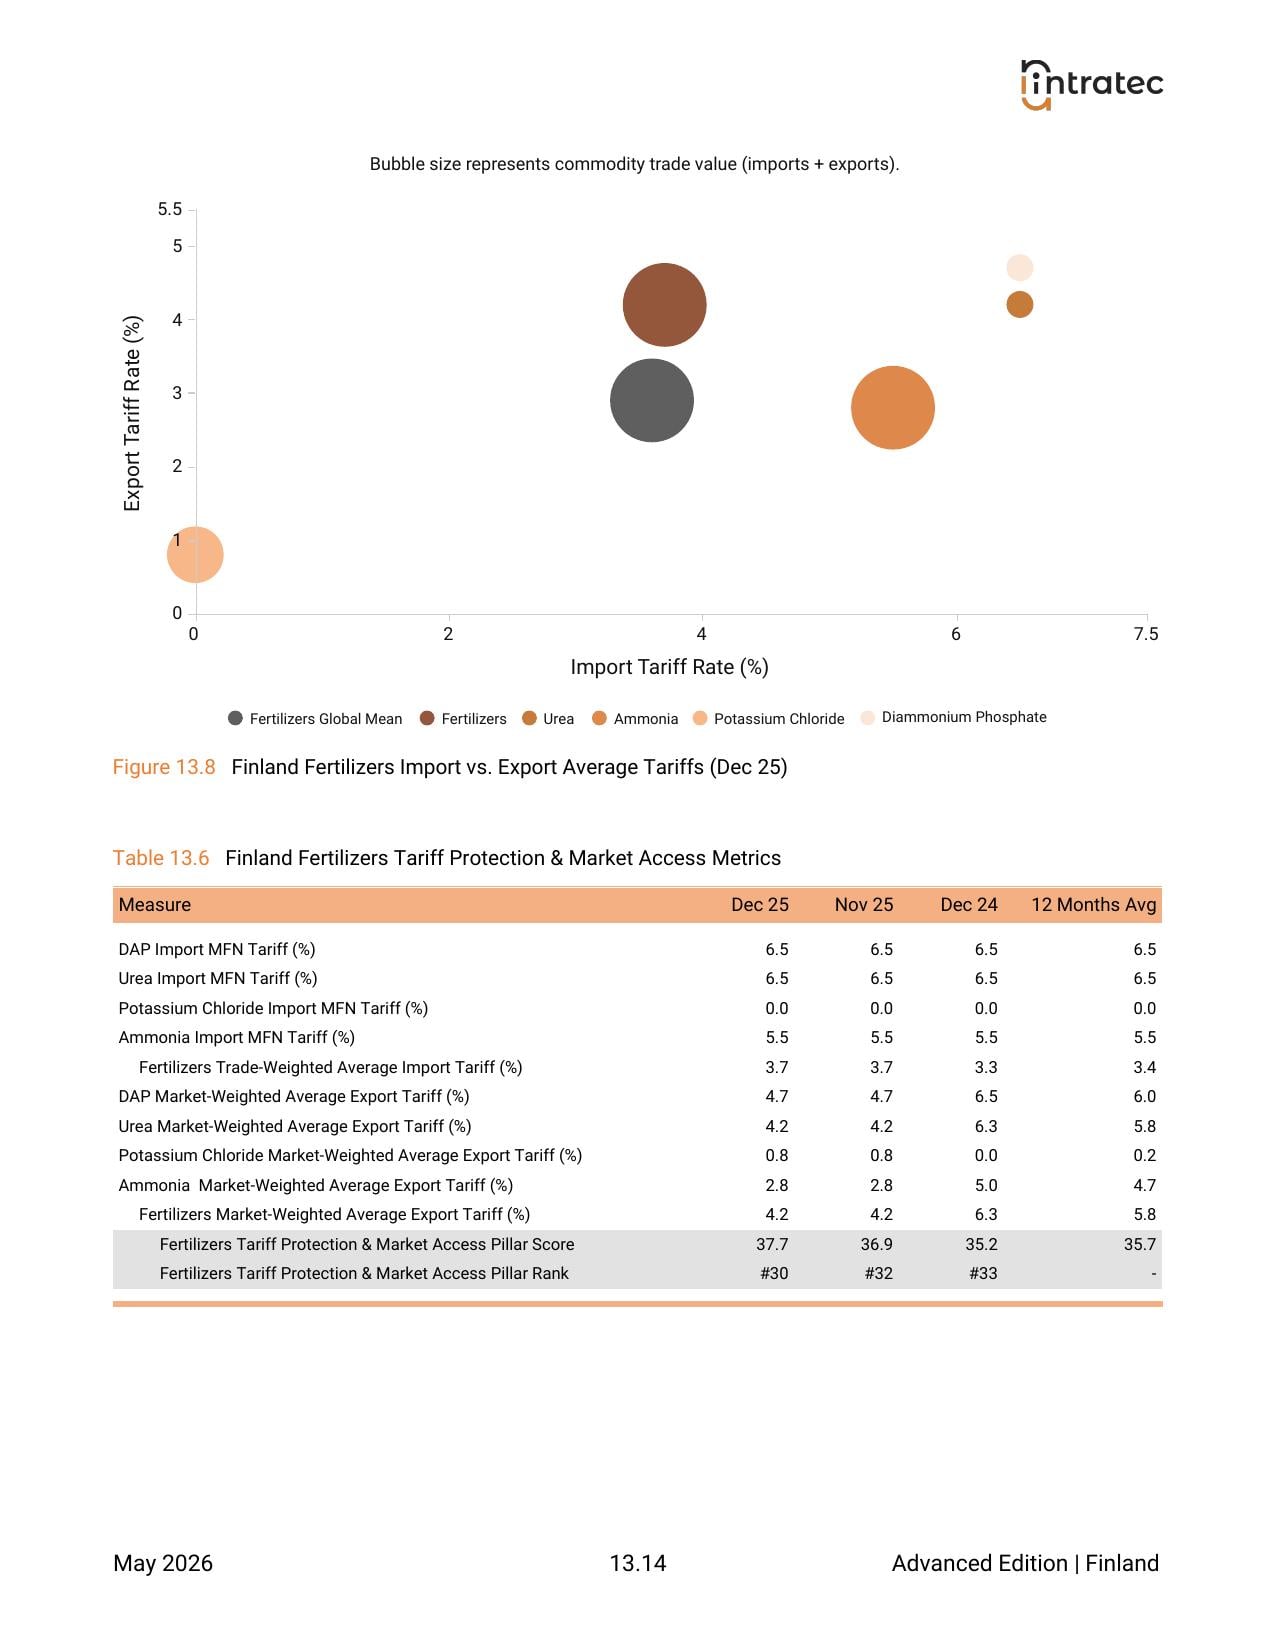
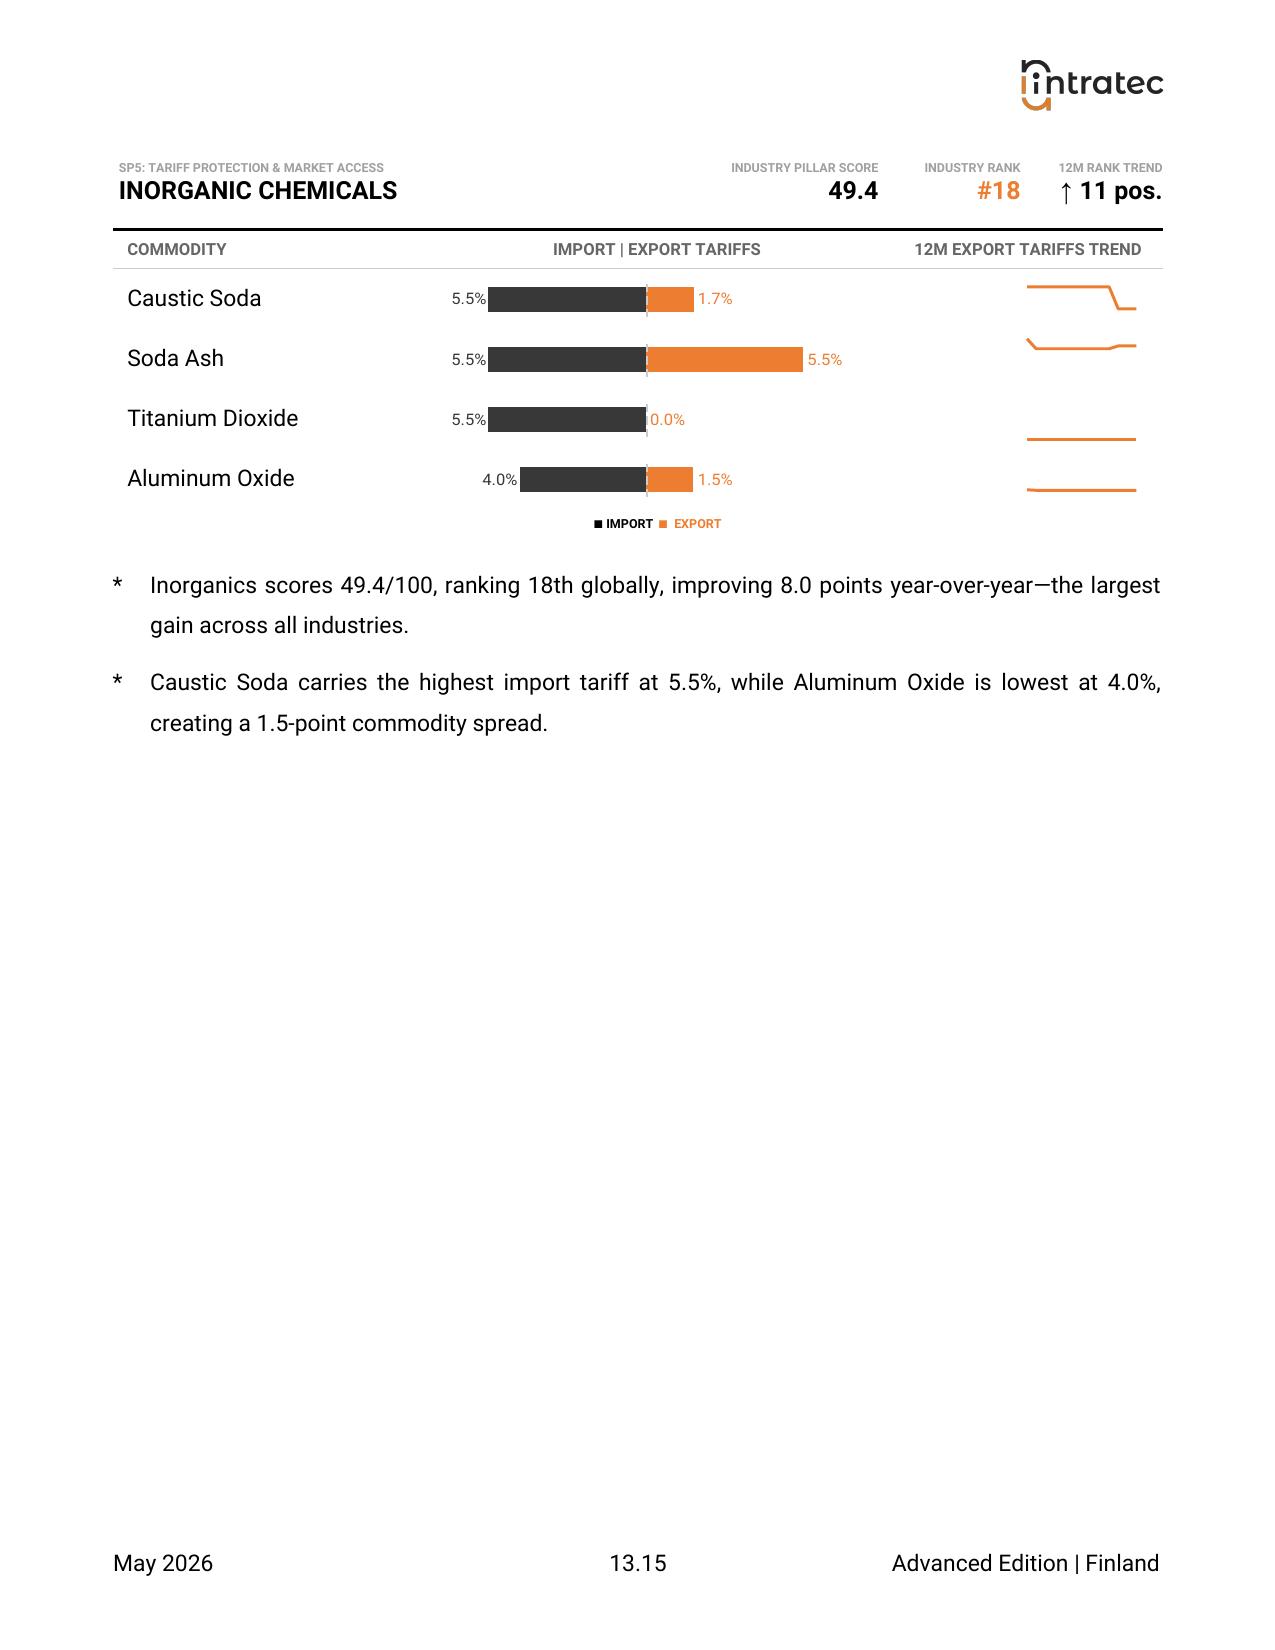
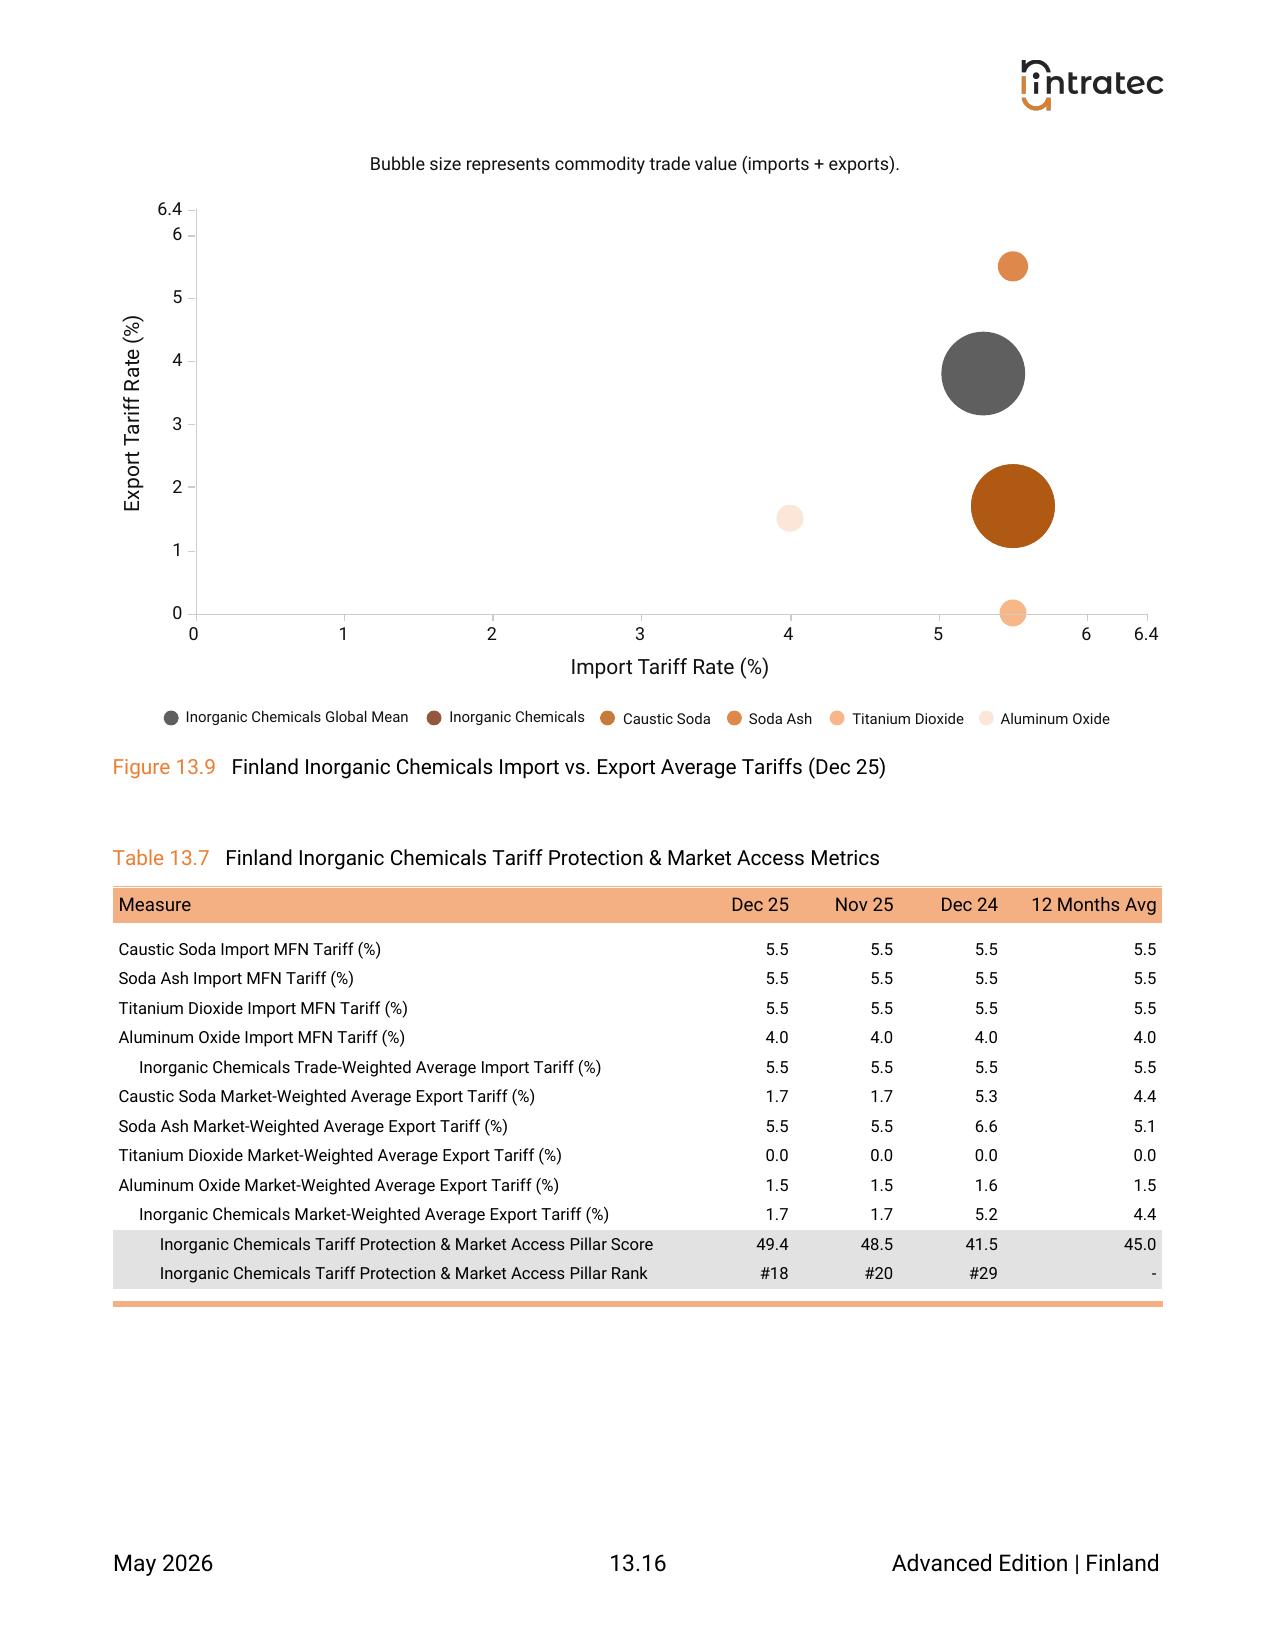
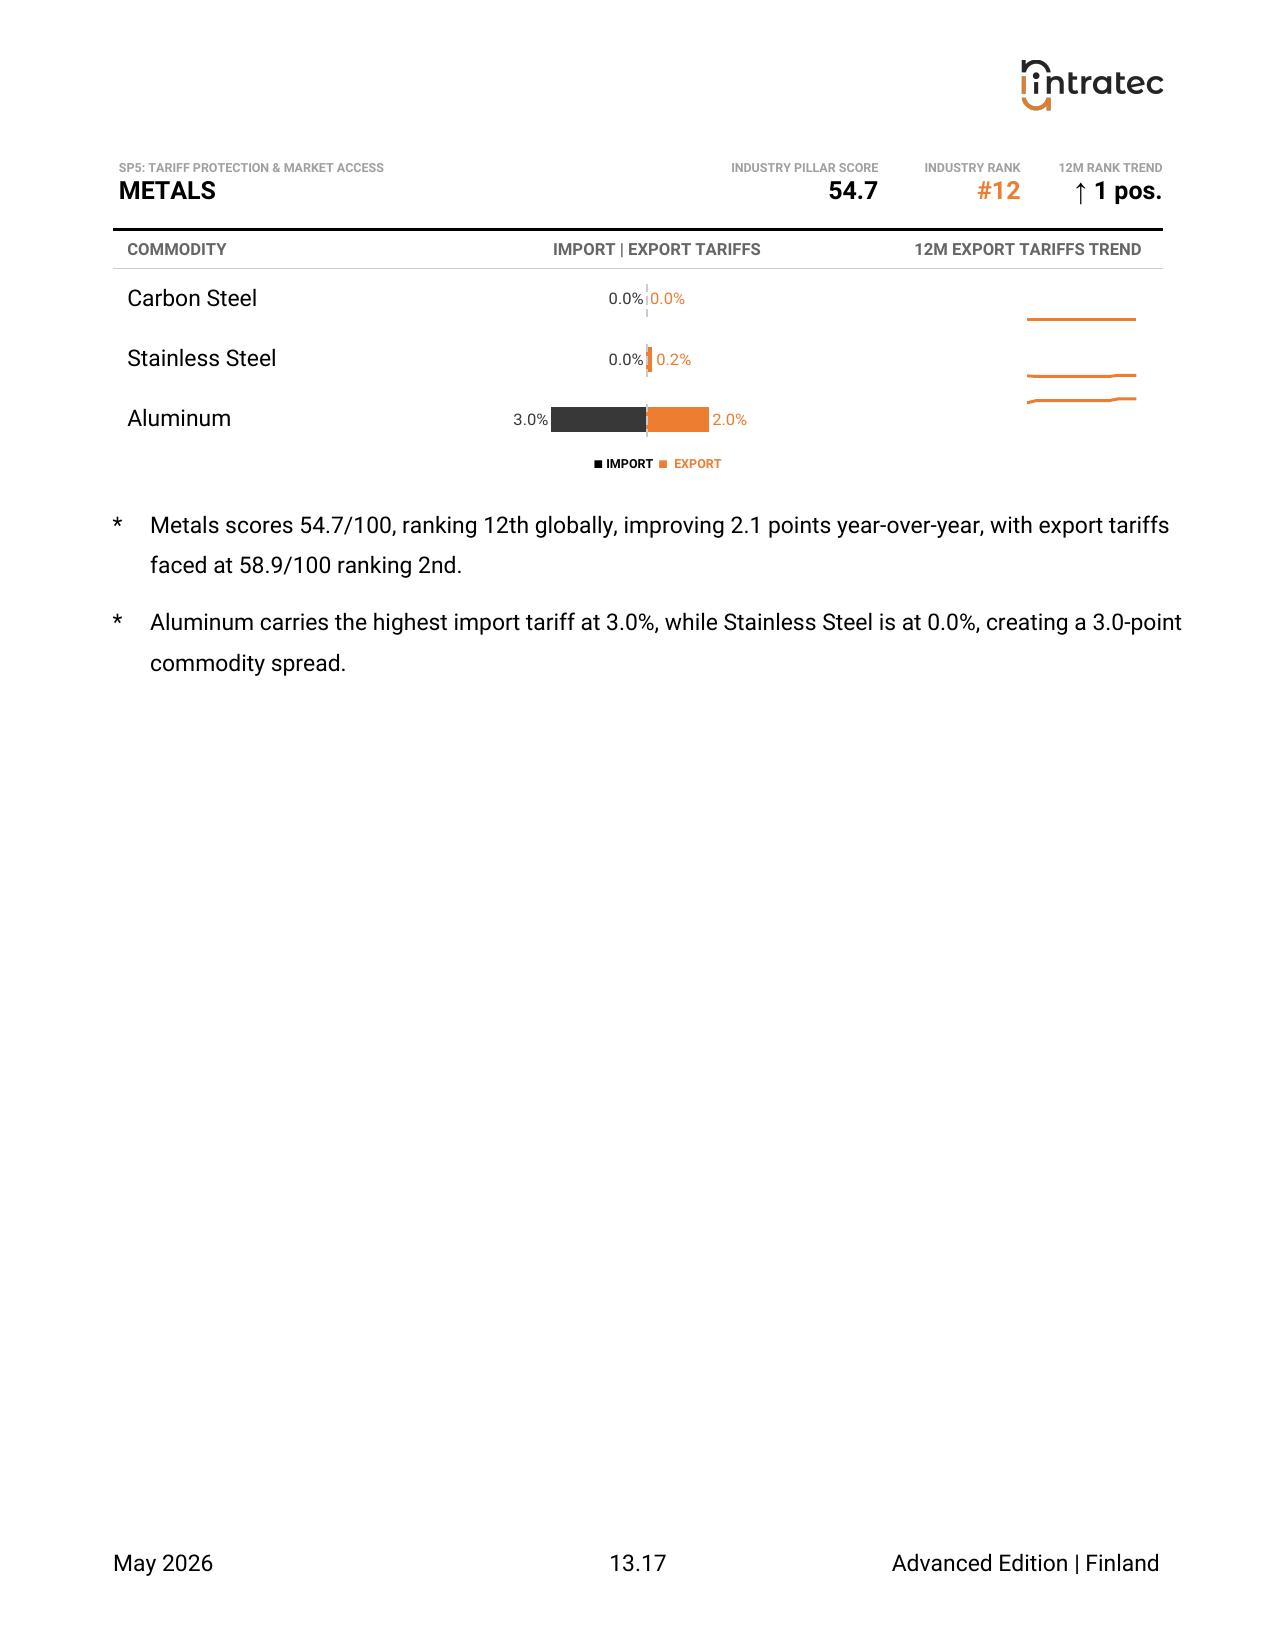
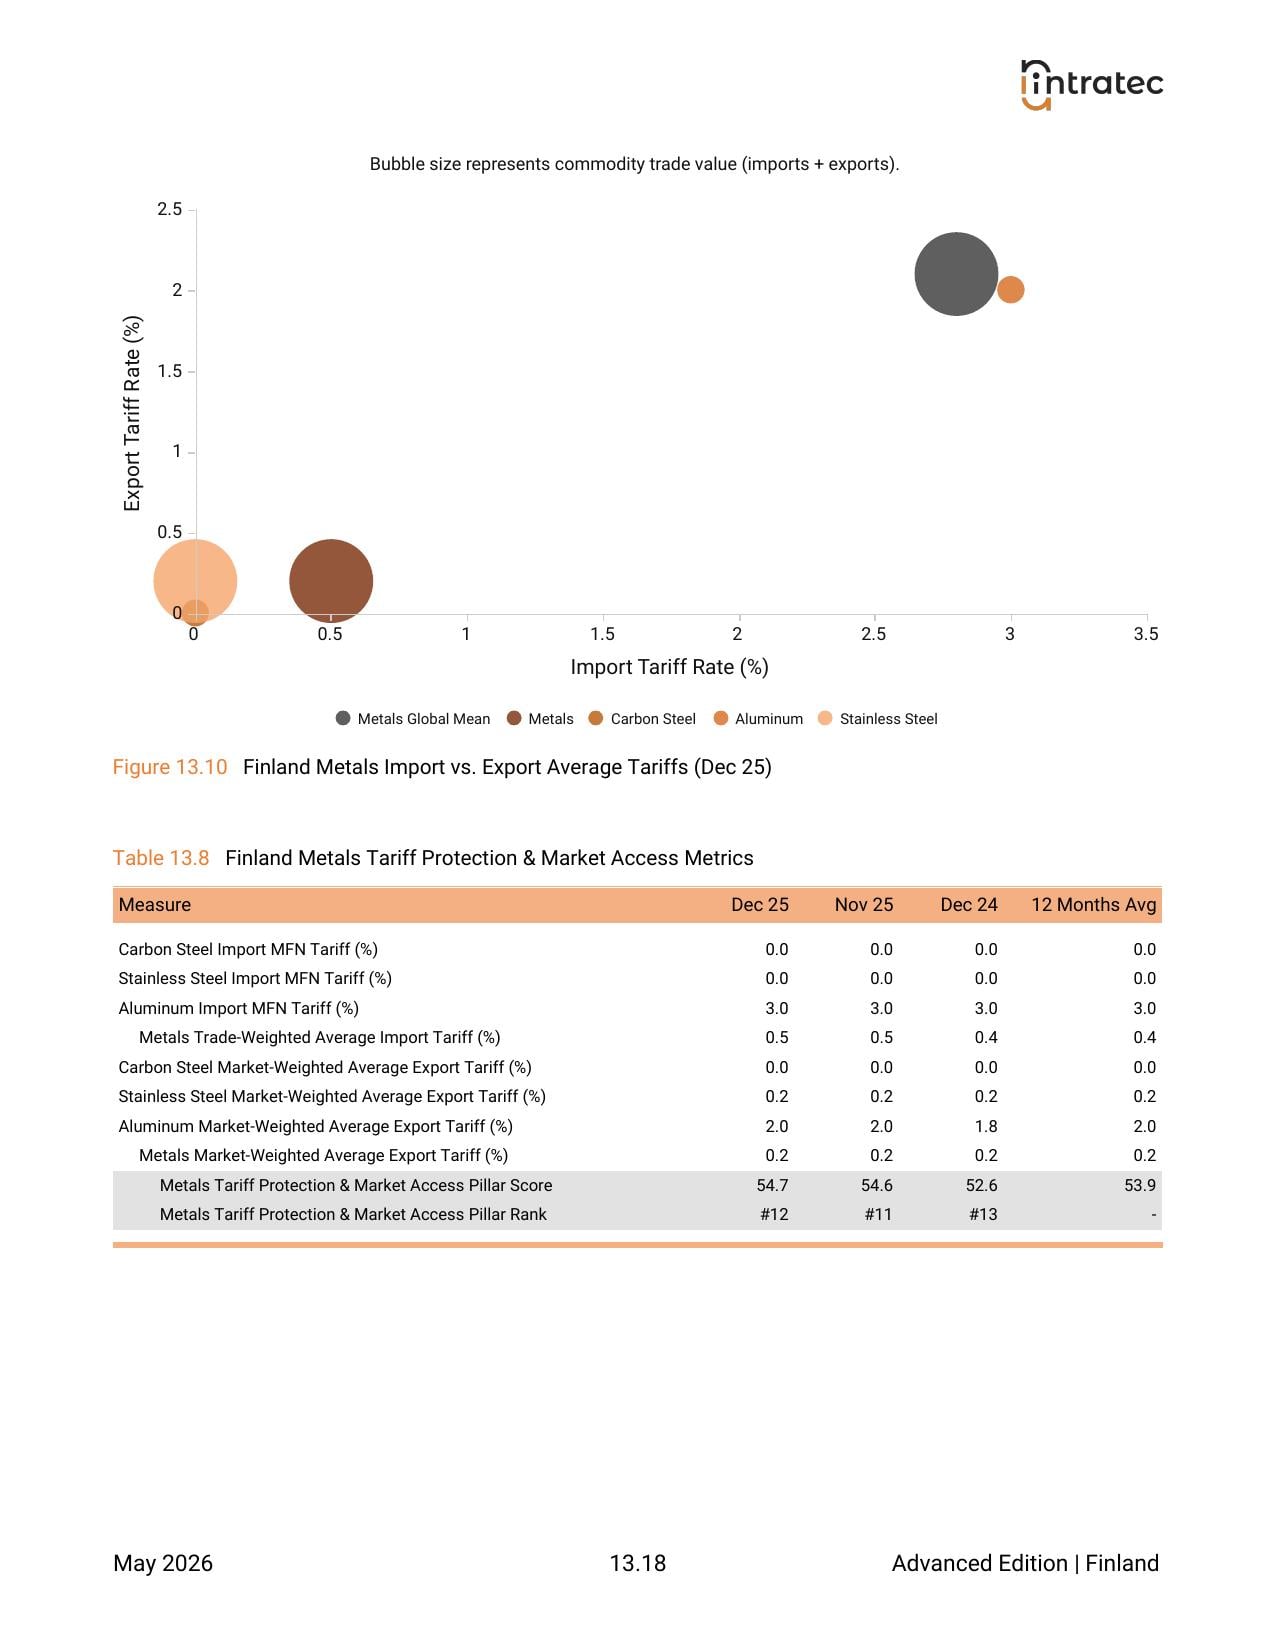
The country's overall tariff ranking, with per-sector standings showing the import and export tariffs each sector faces.
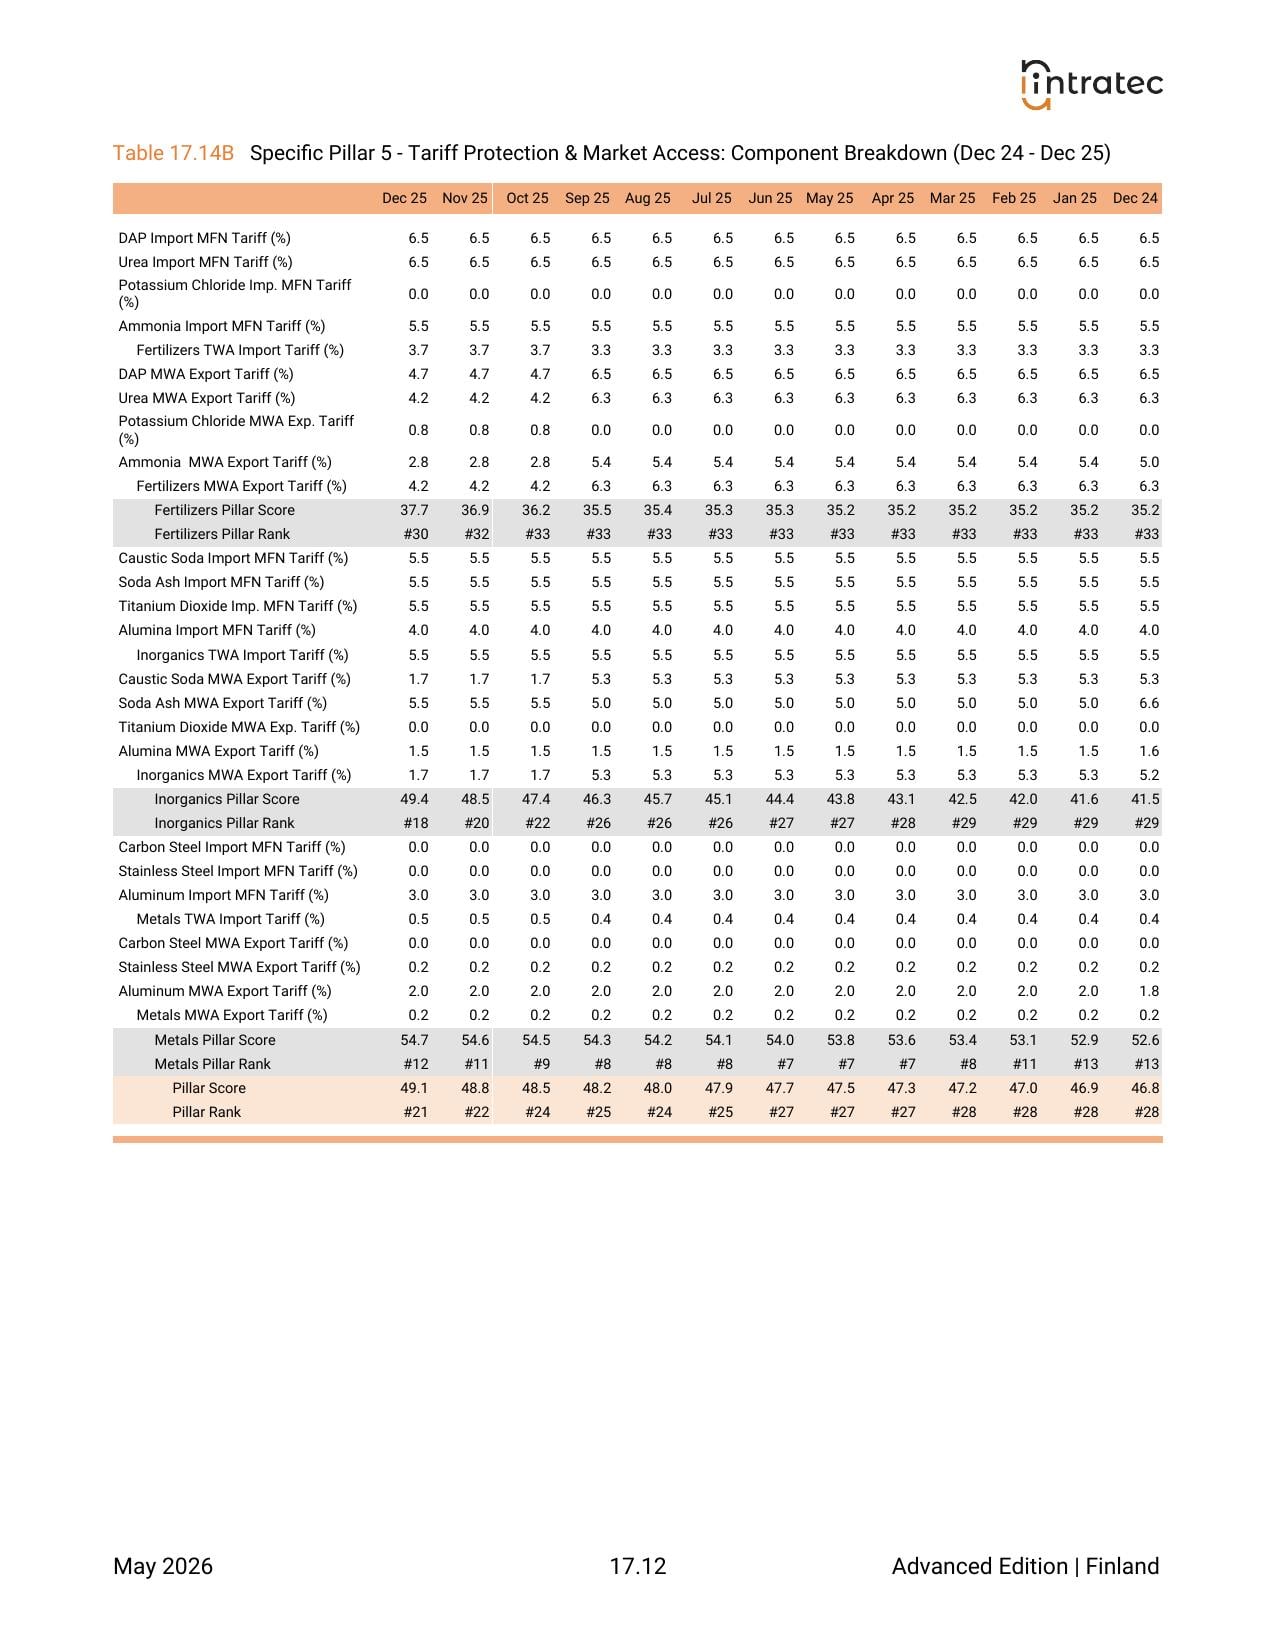
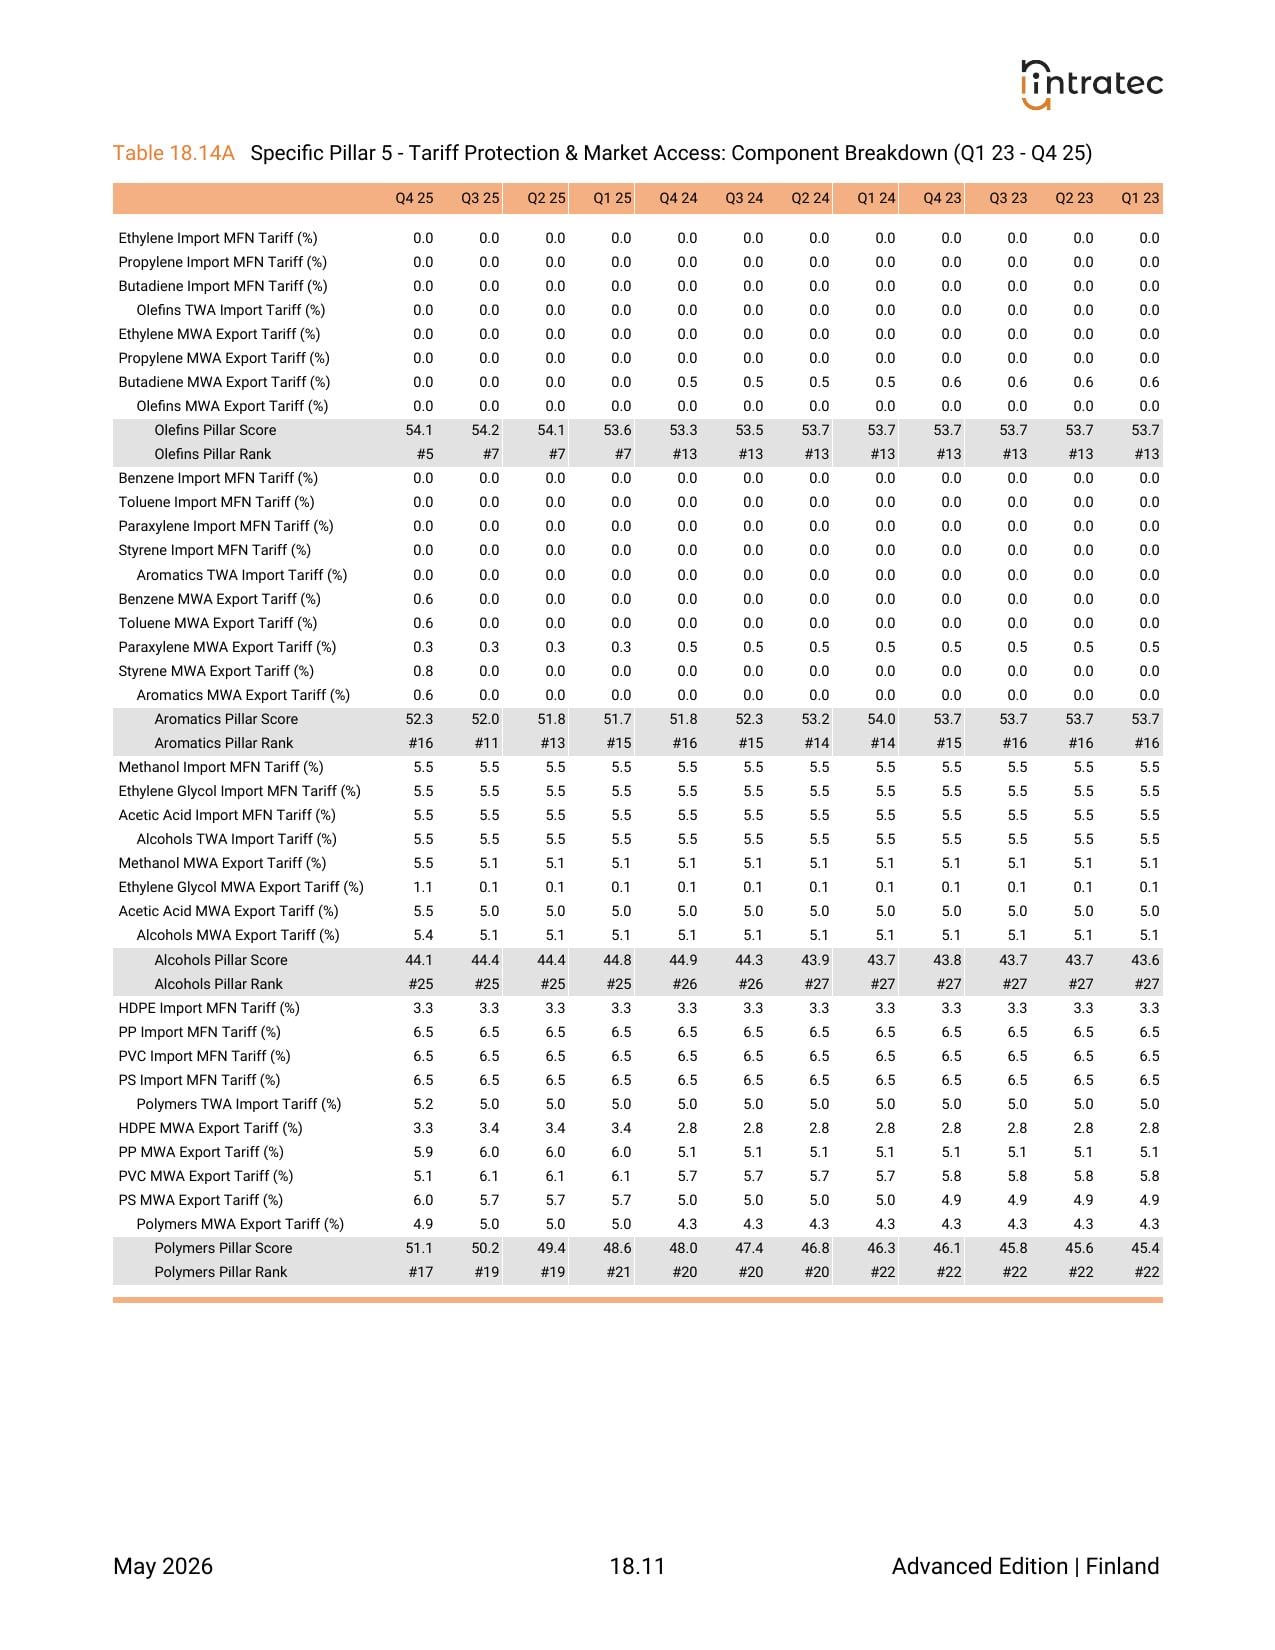
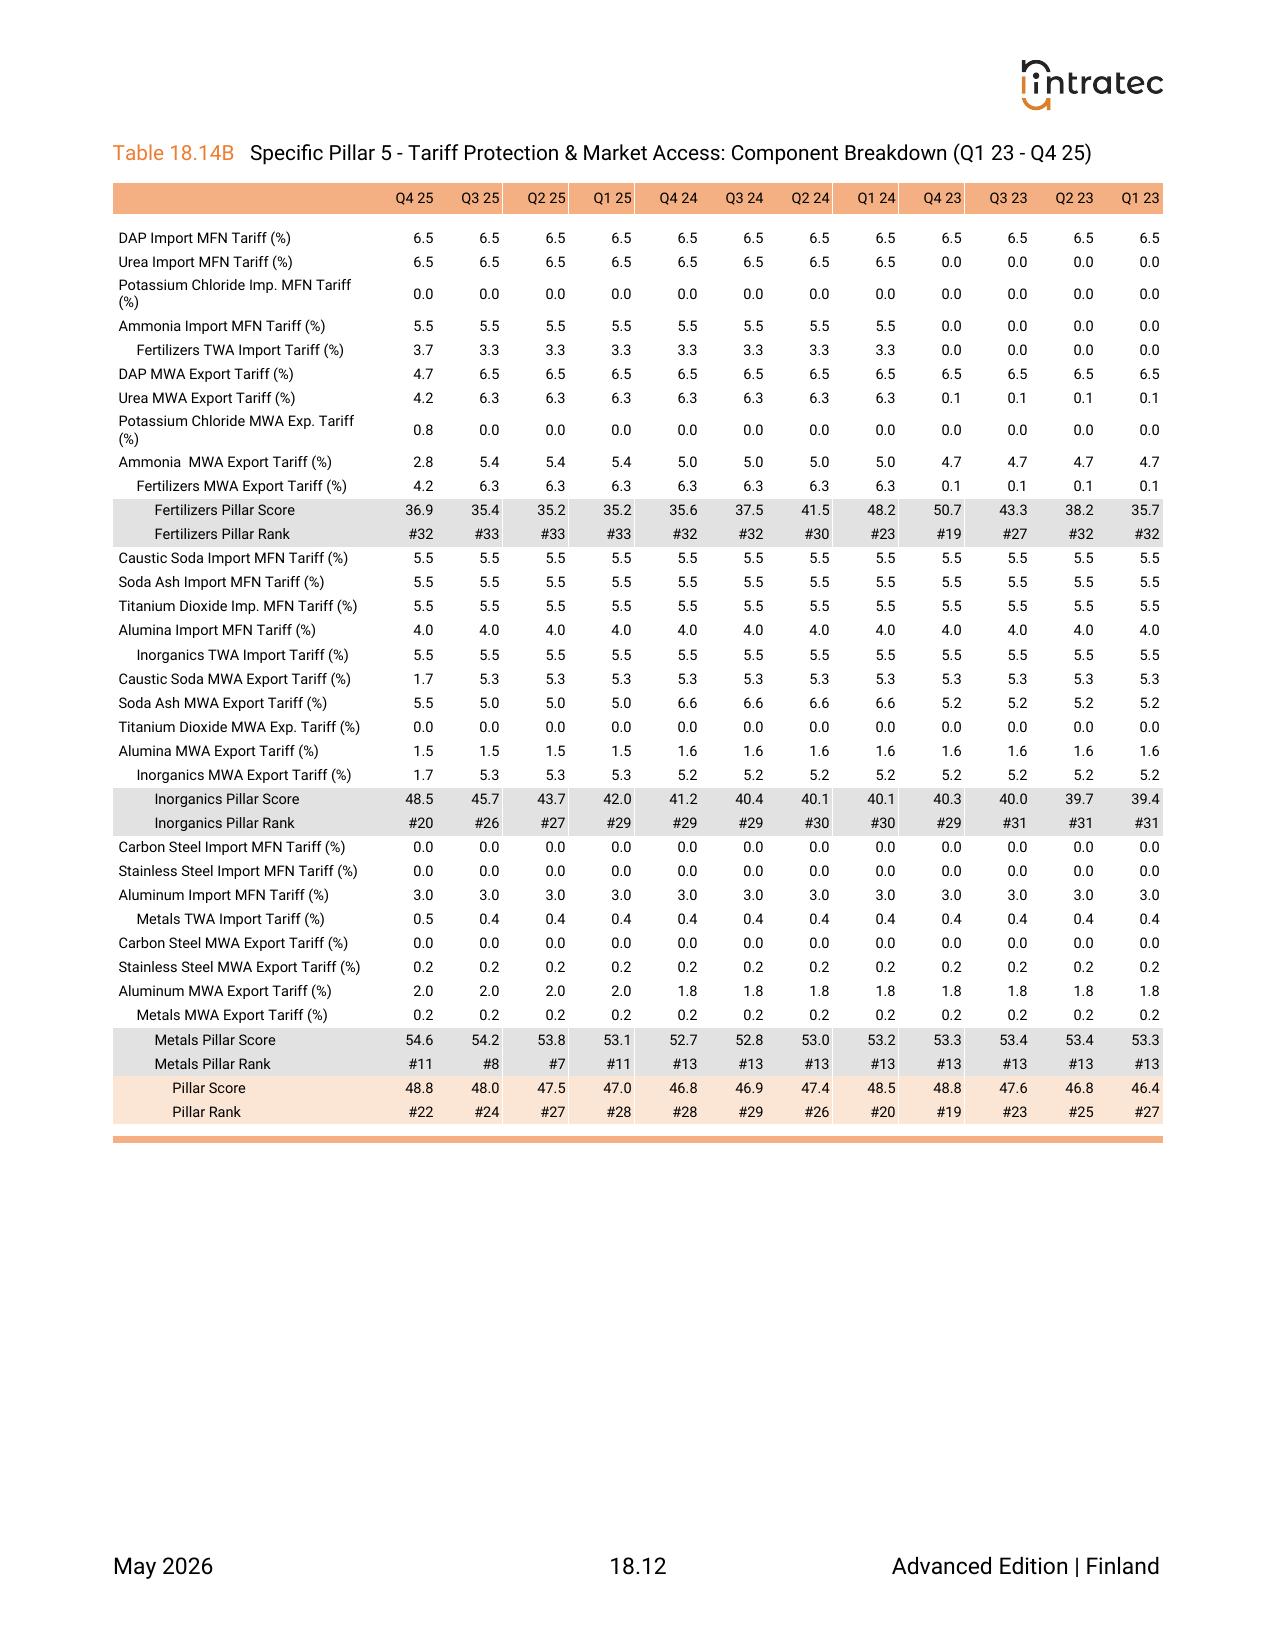
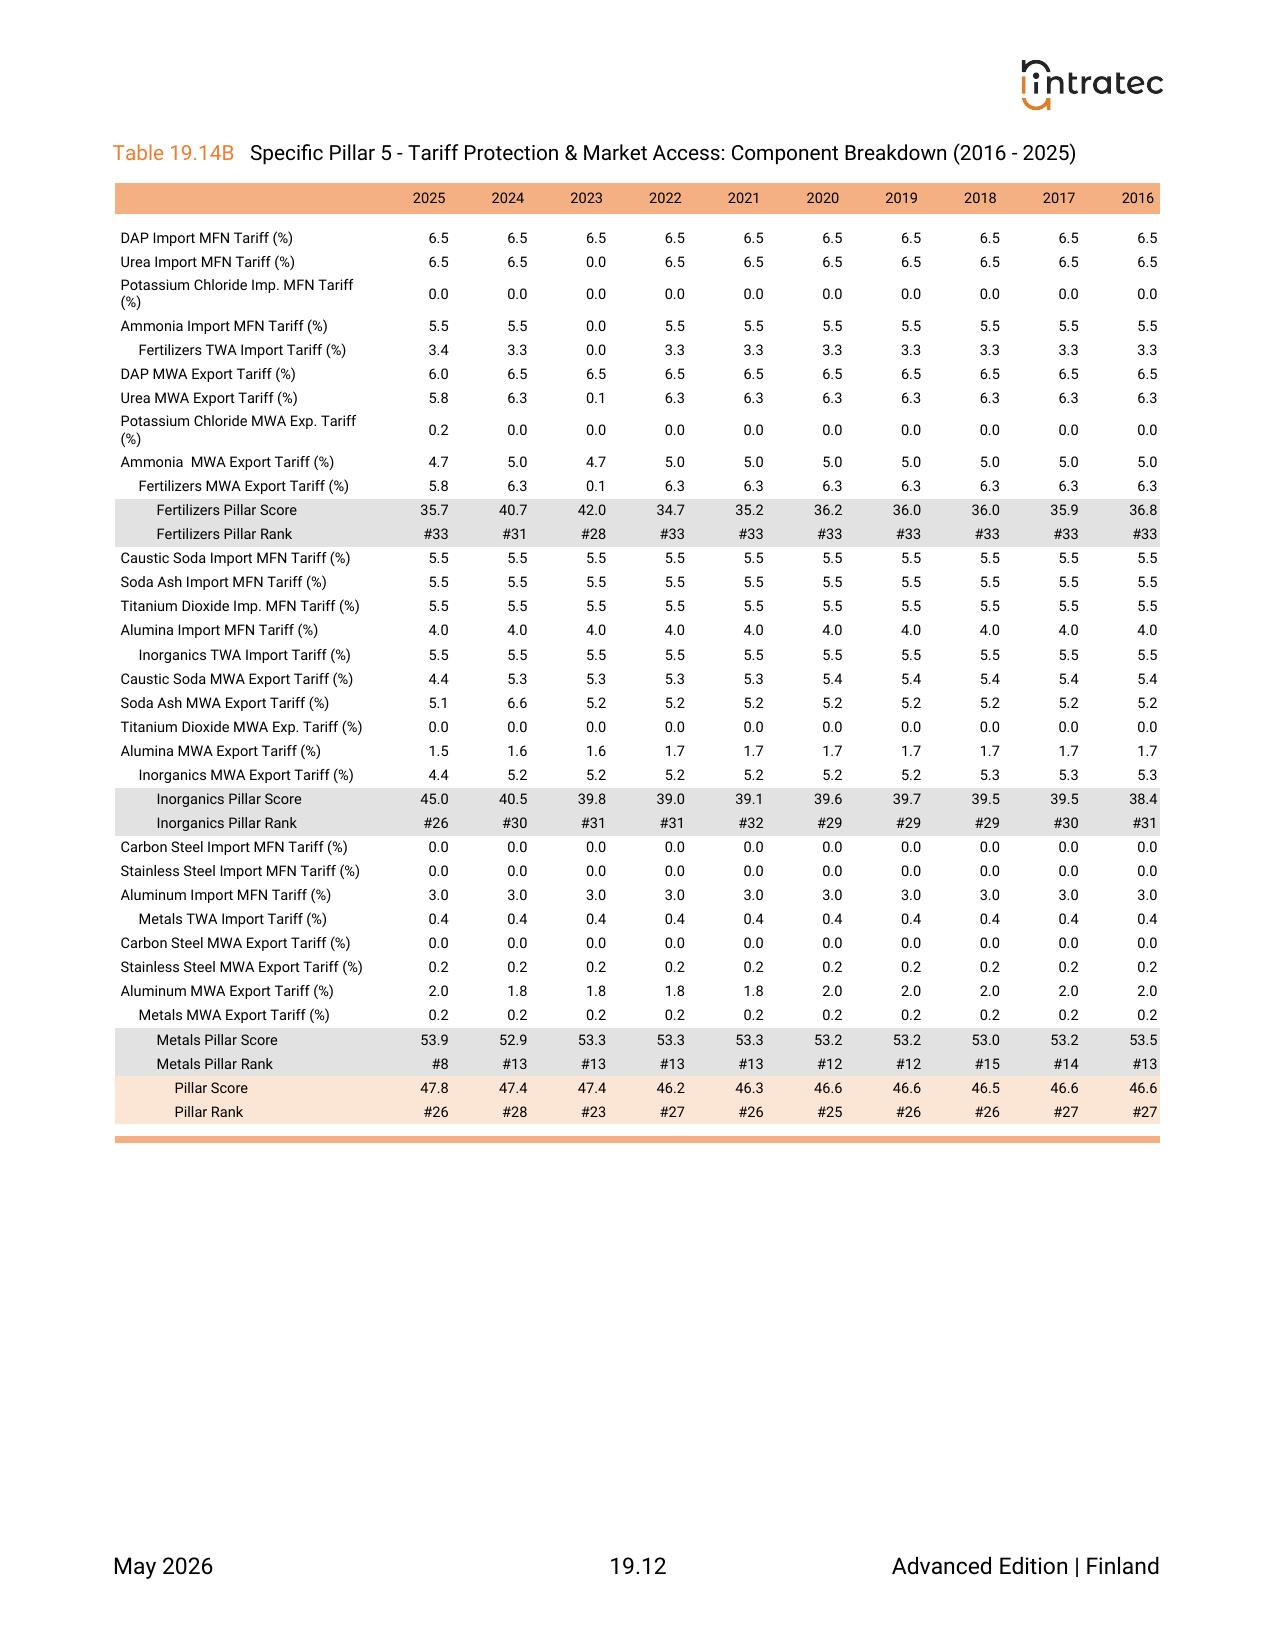
Tariff Protection & Market Access - Pillar Breakdown
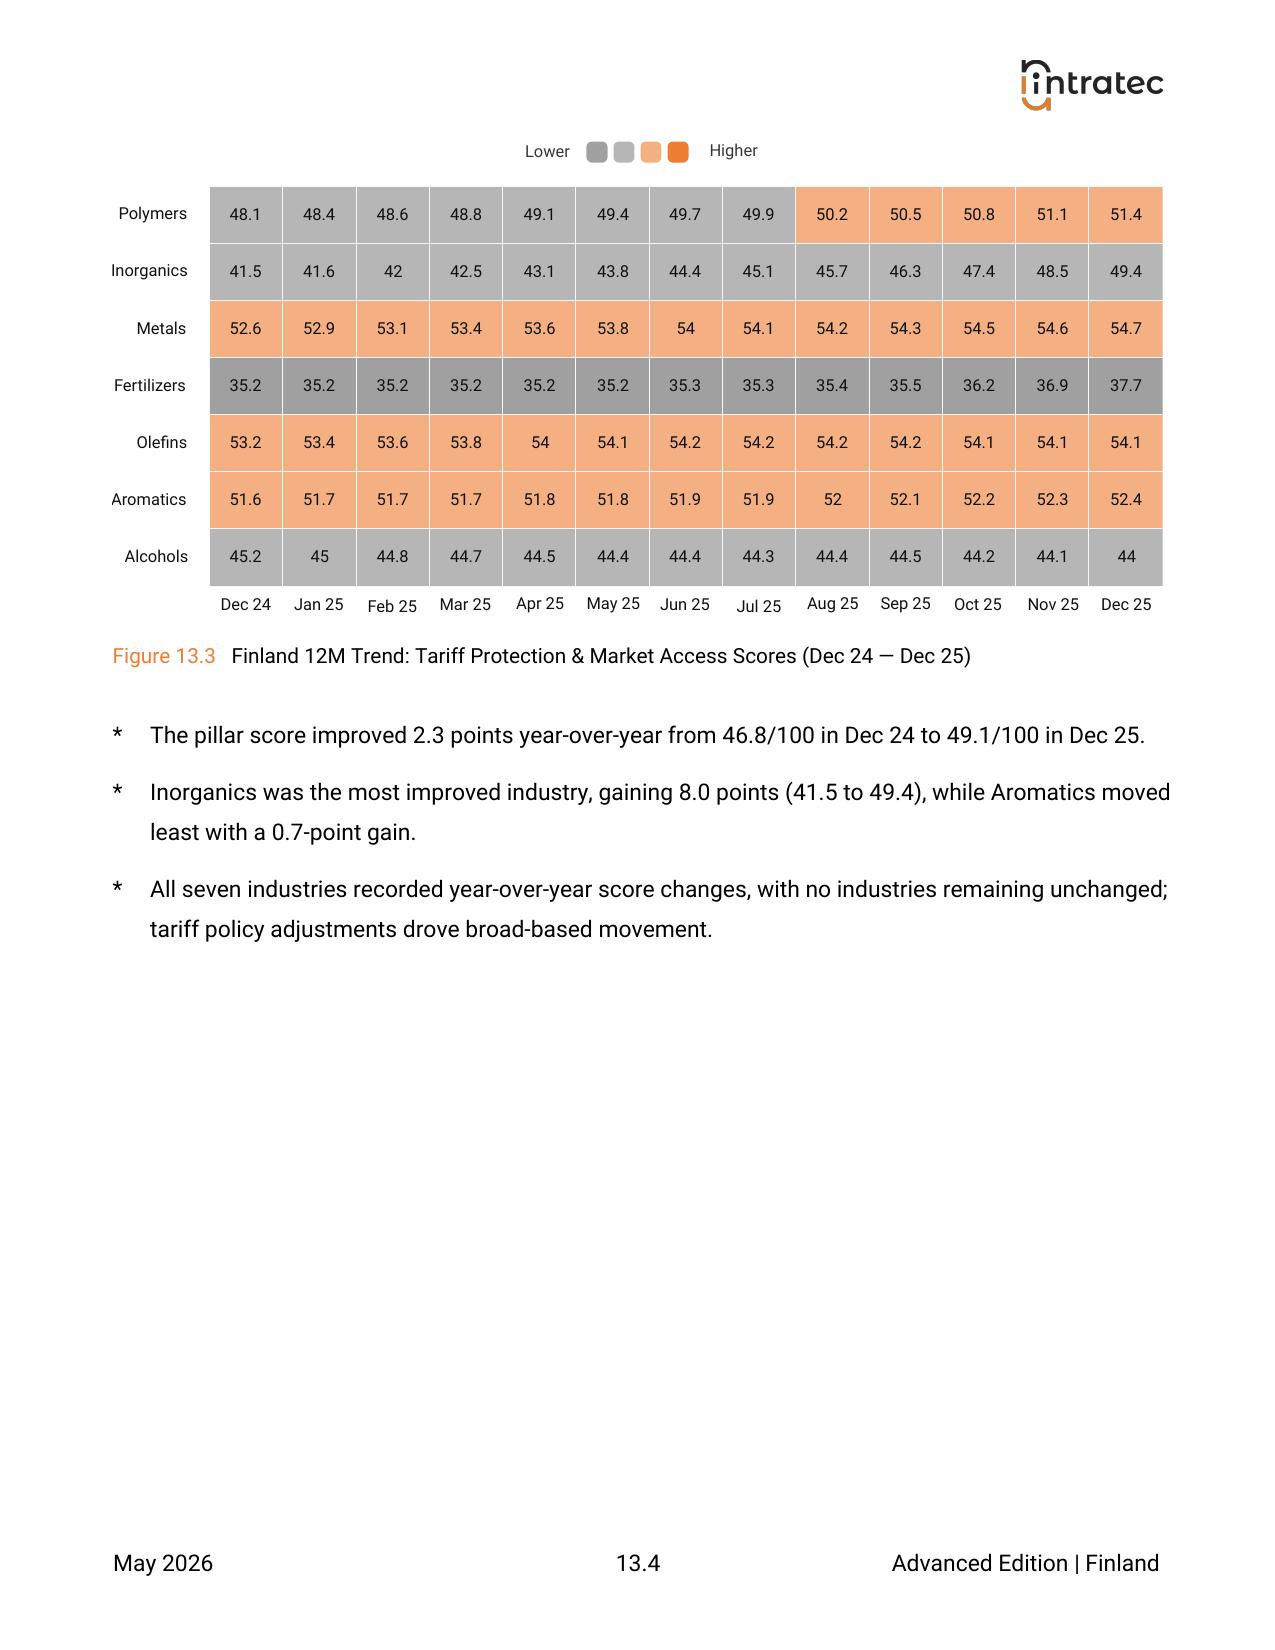
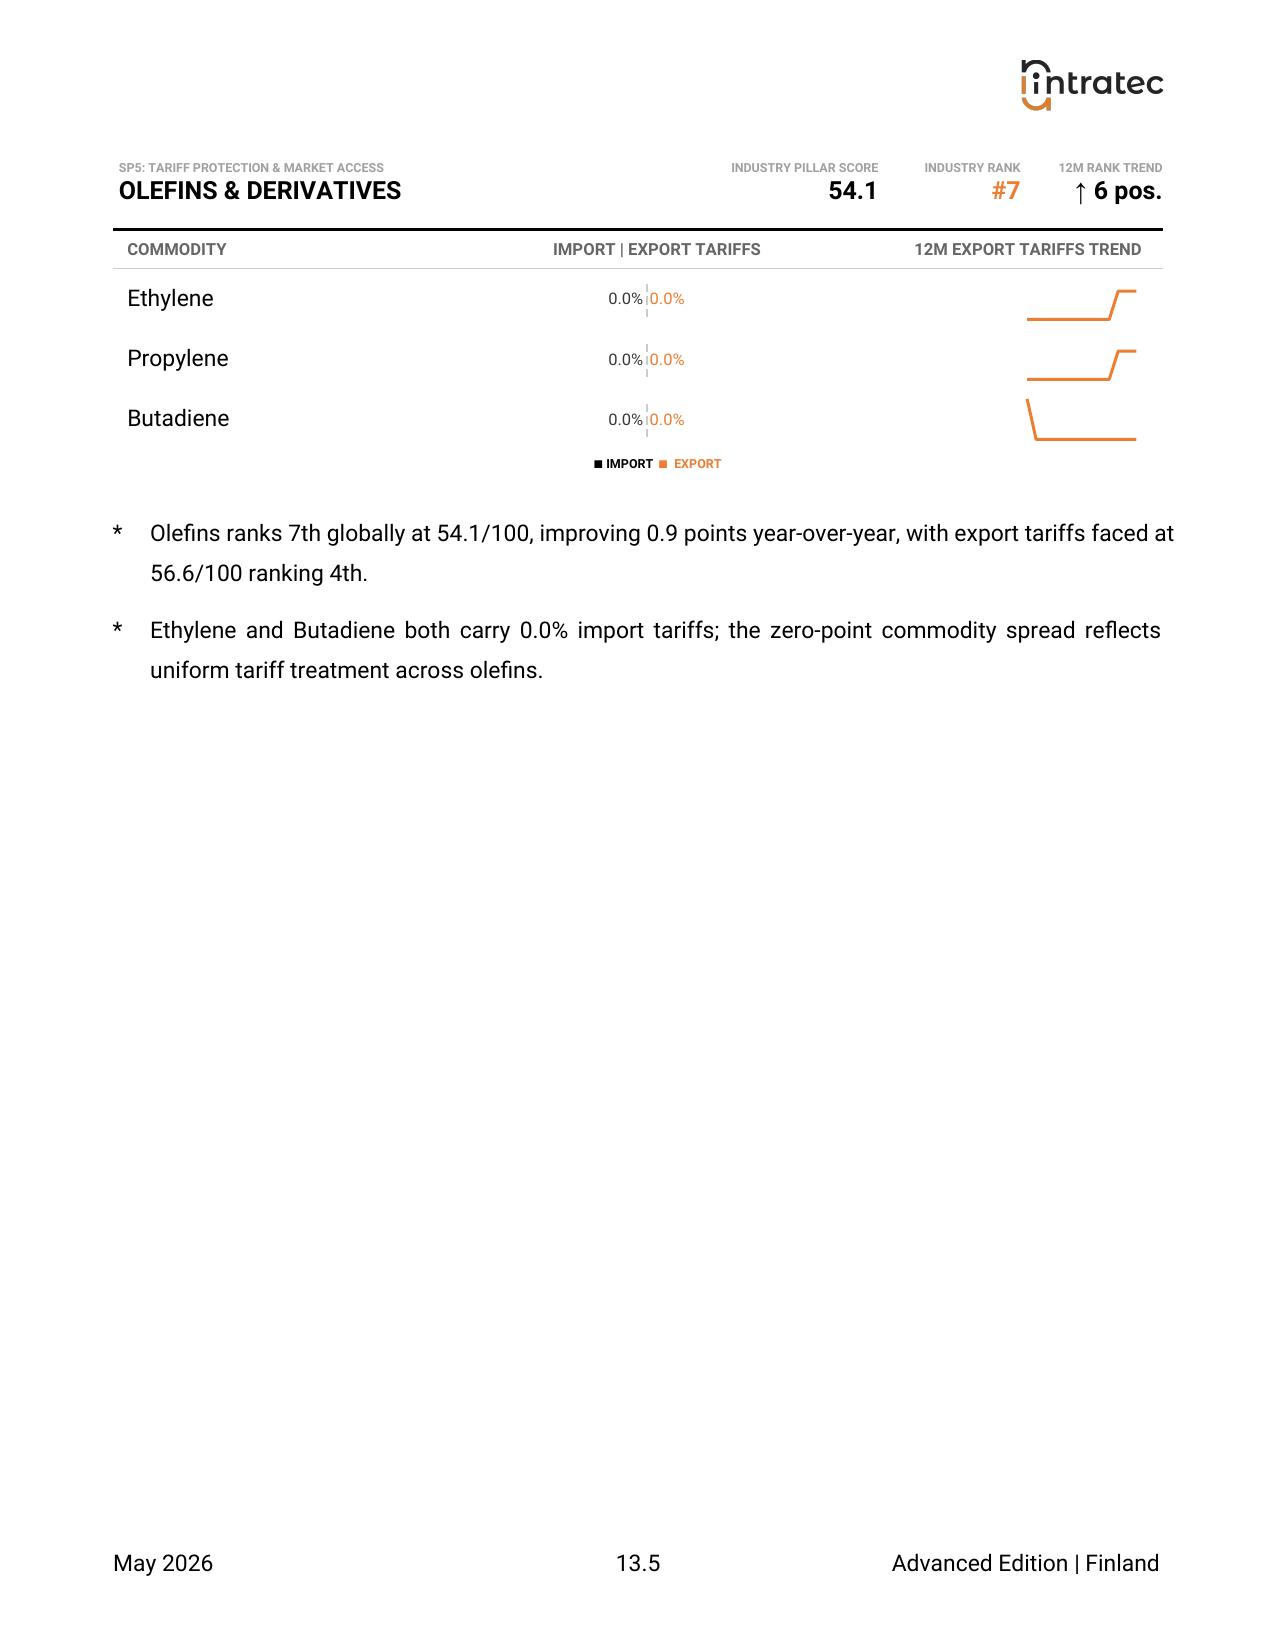
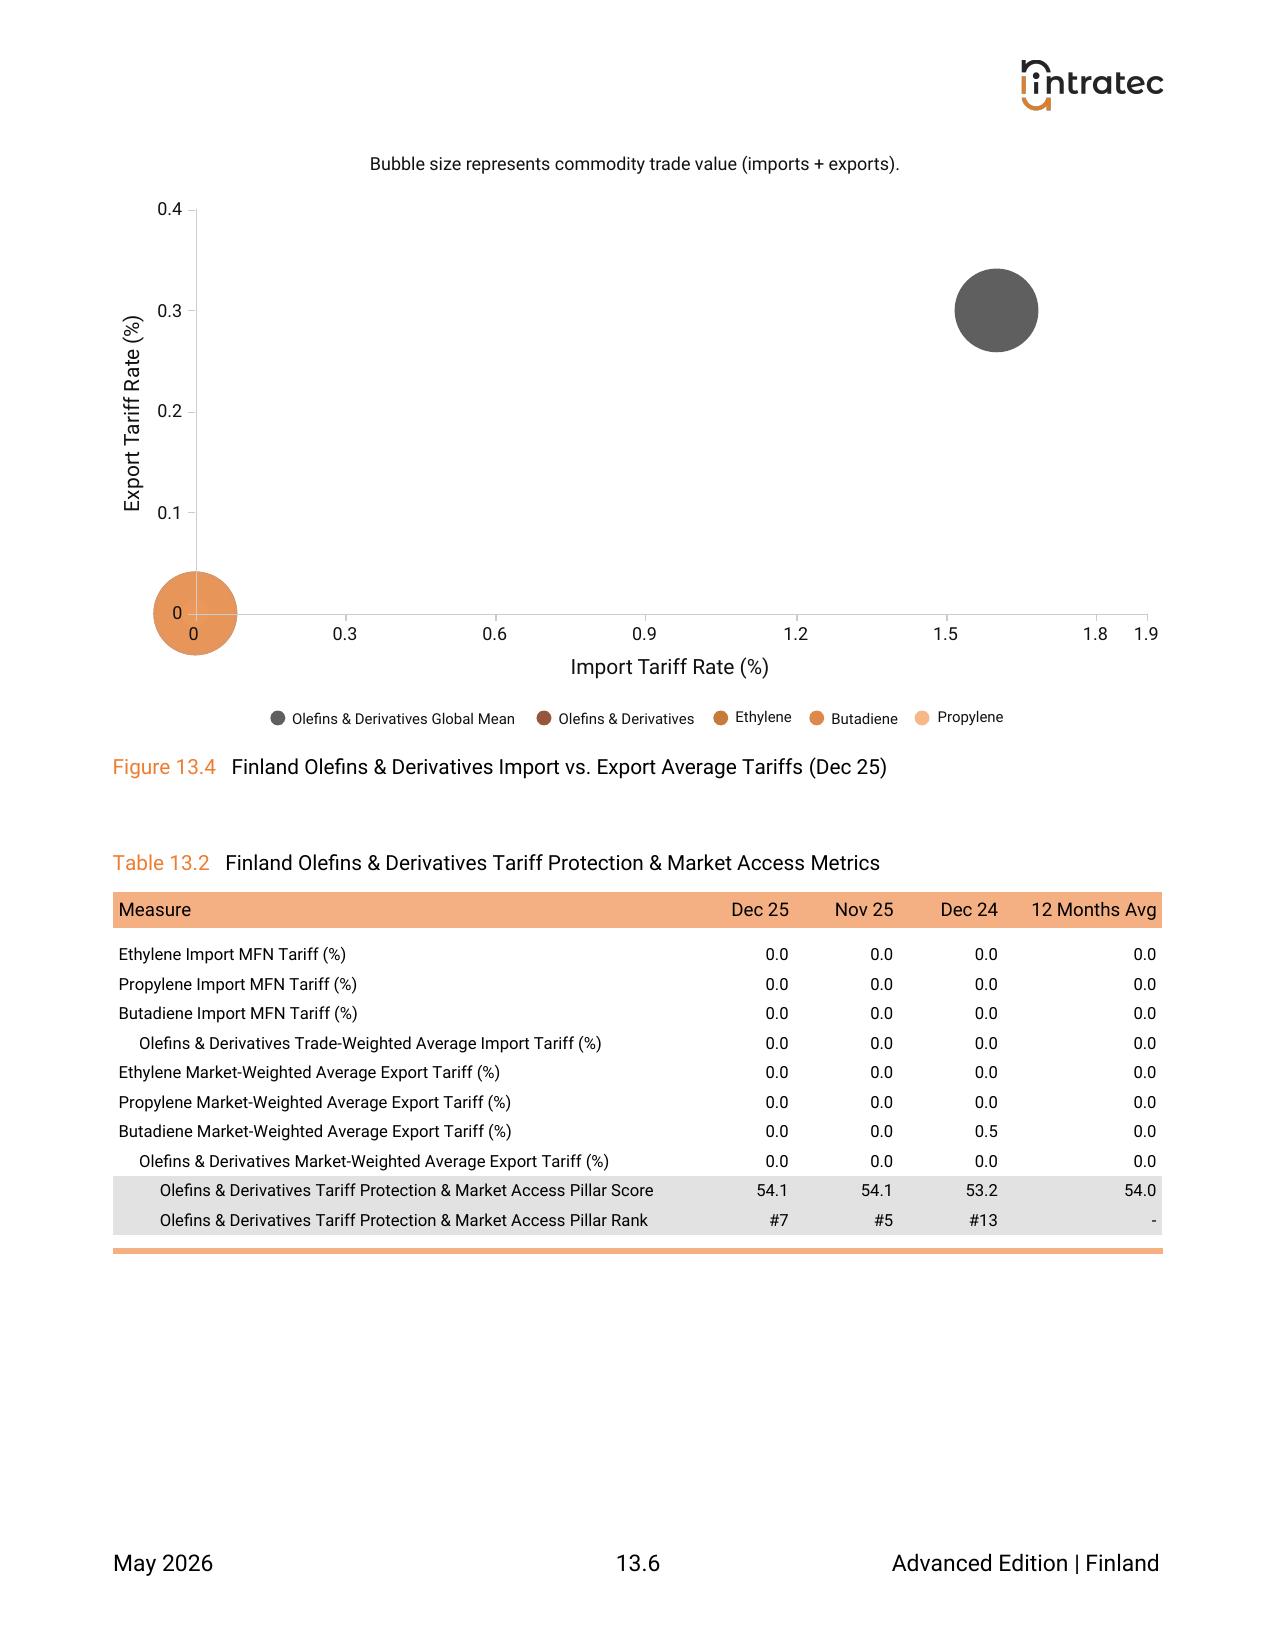
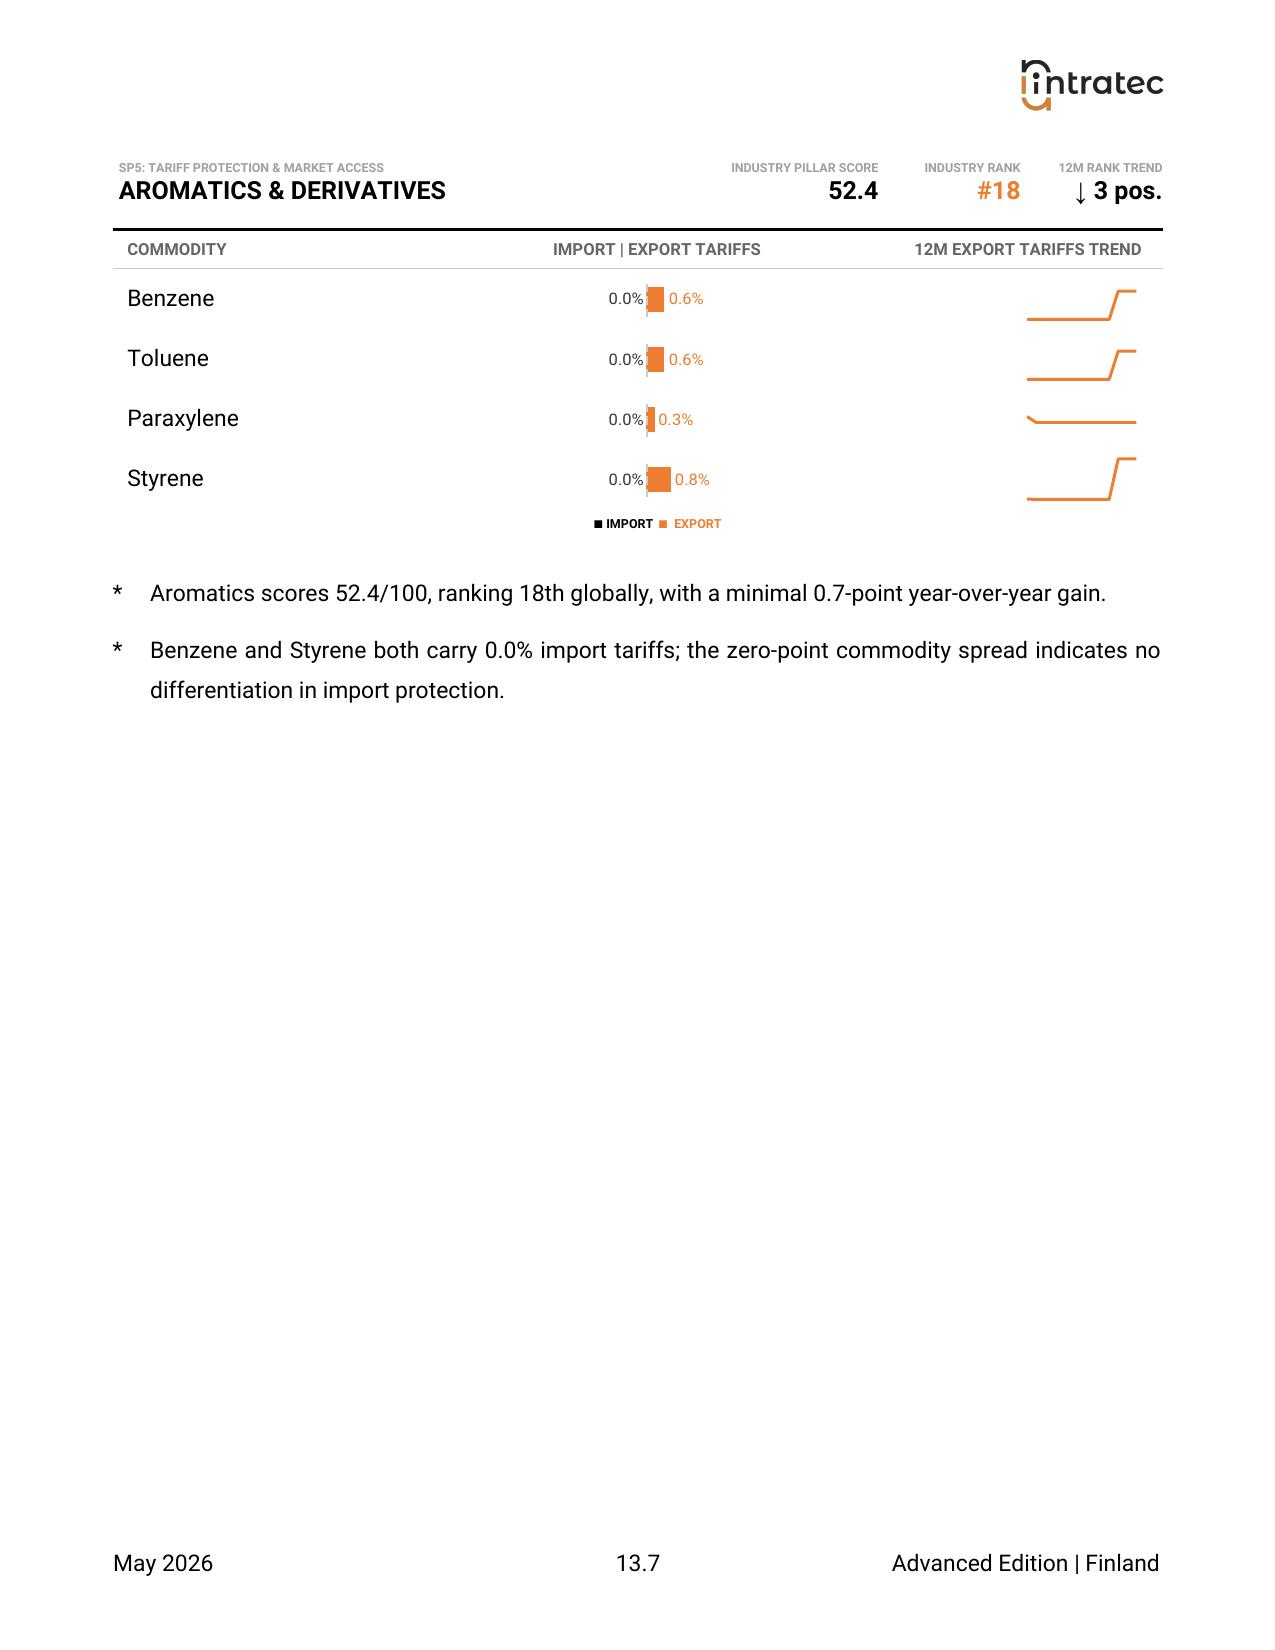
Effective tariff rates for every commodity in the program, on both the import and export sides, benchmarked globally, with tariff trends across all 7 sectors over the past 12 months.
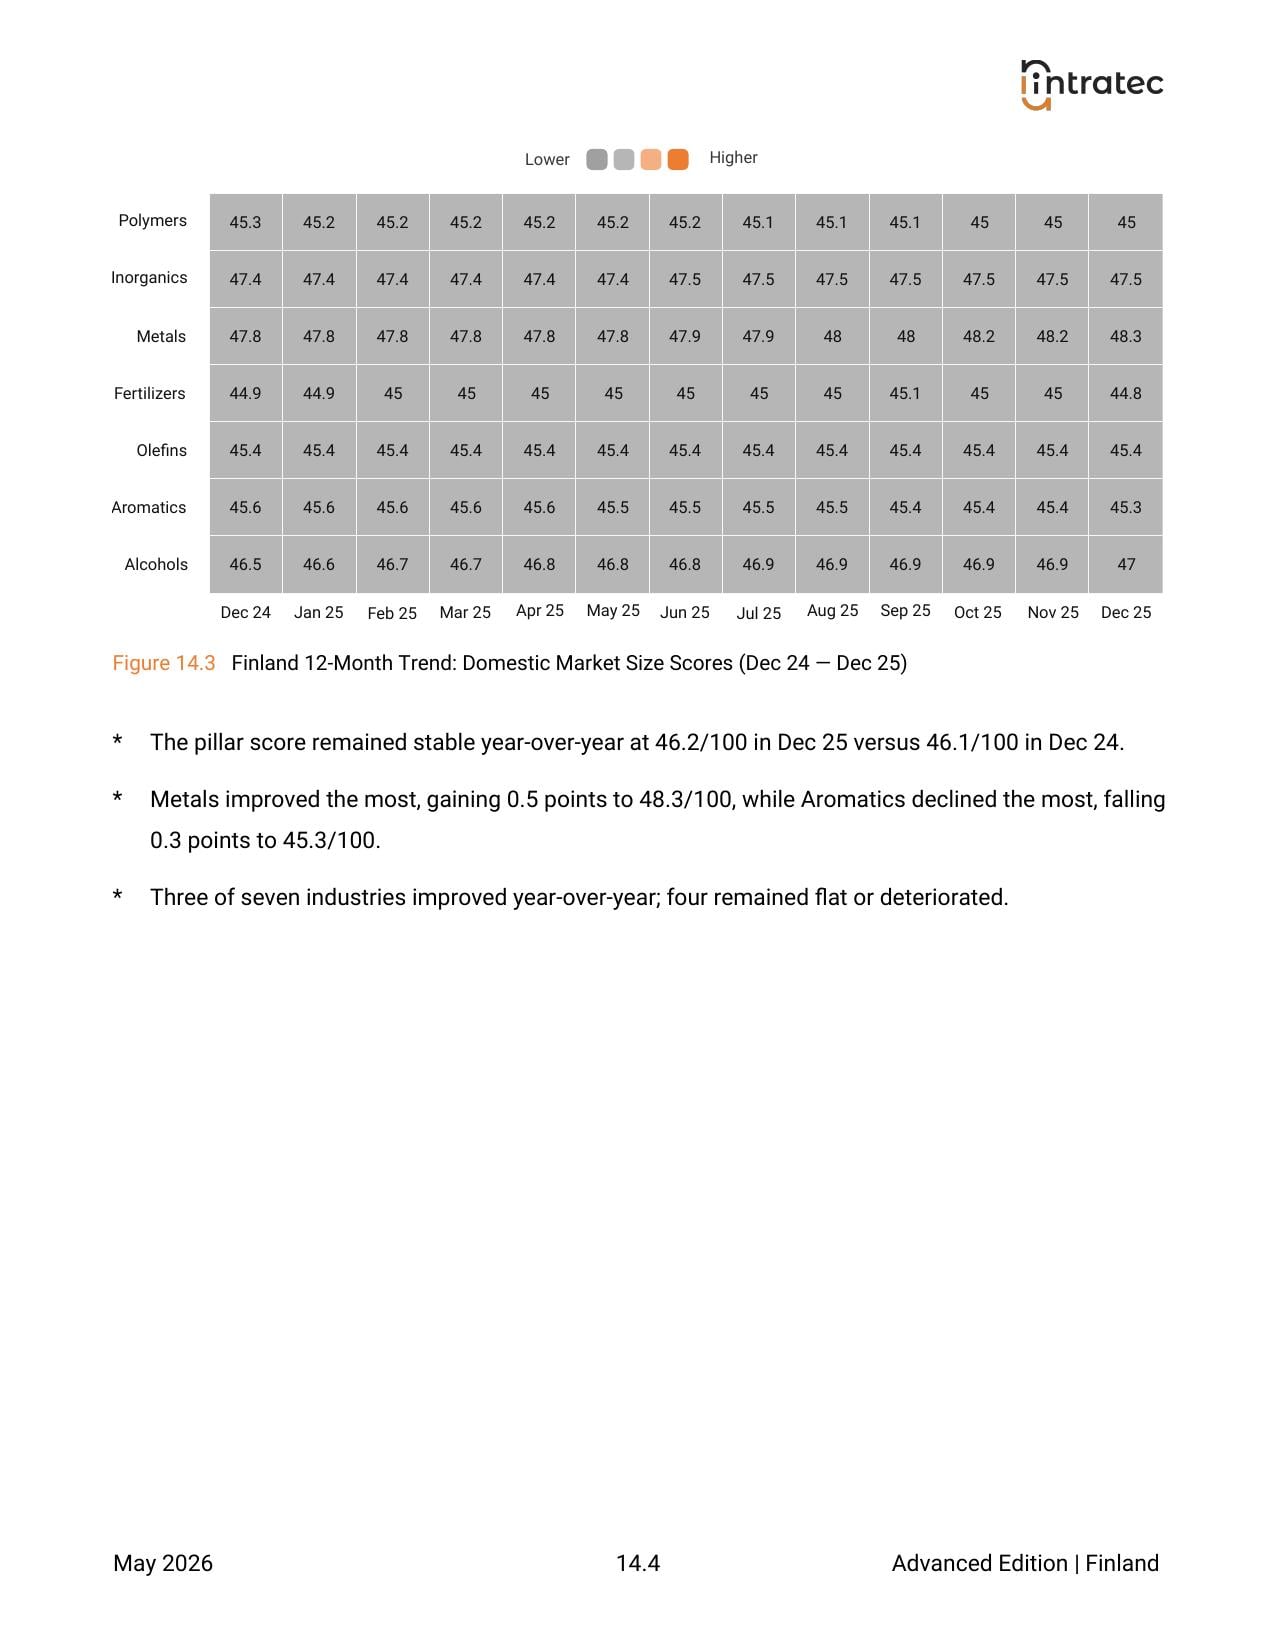
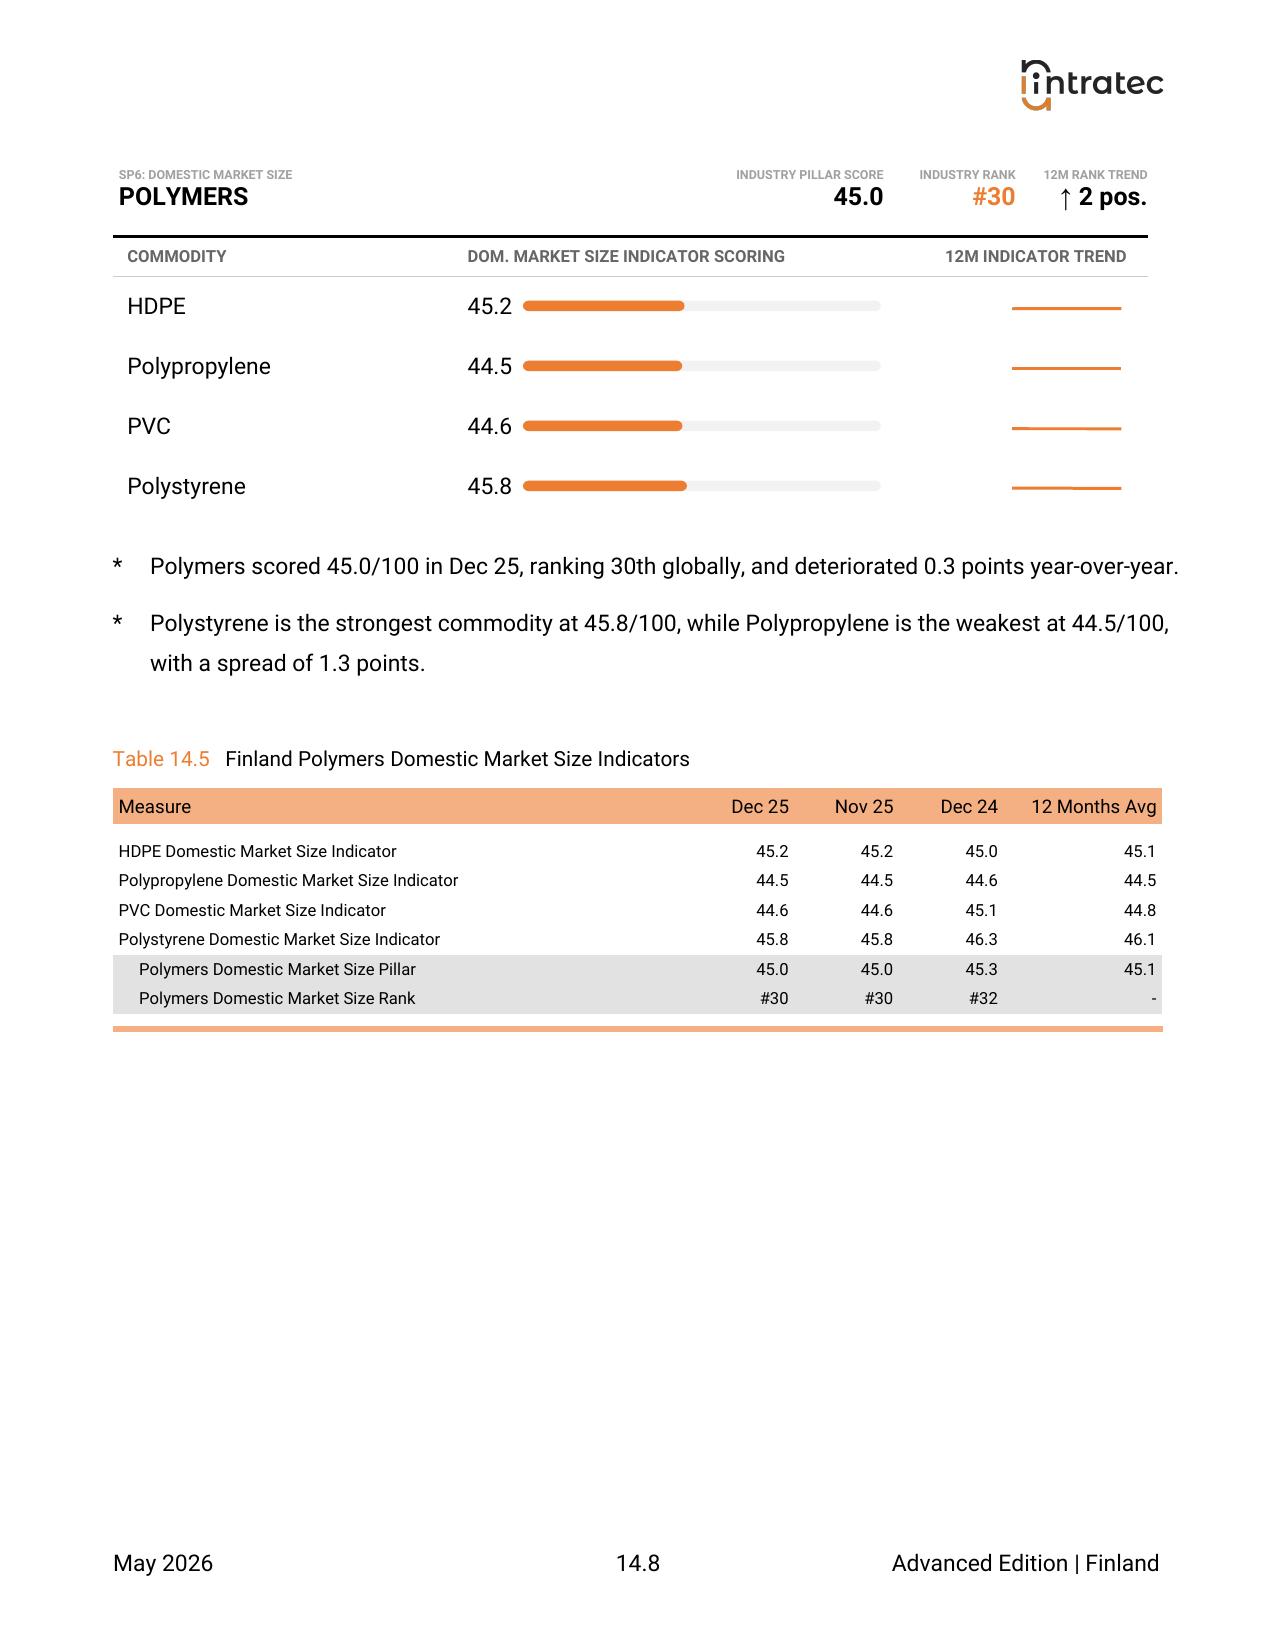
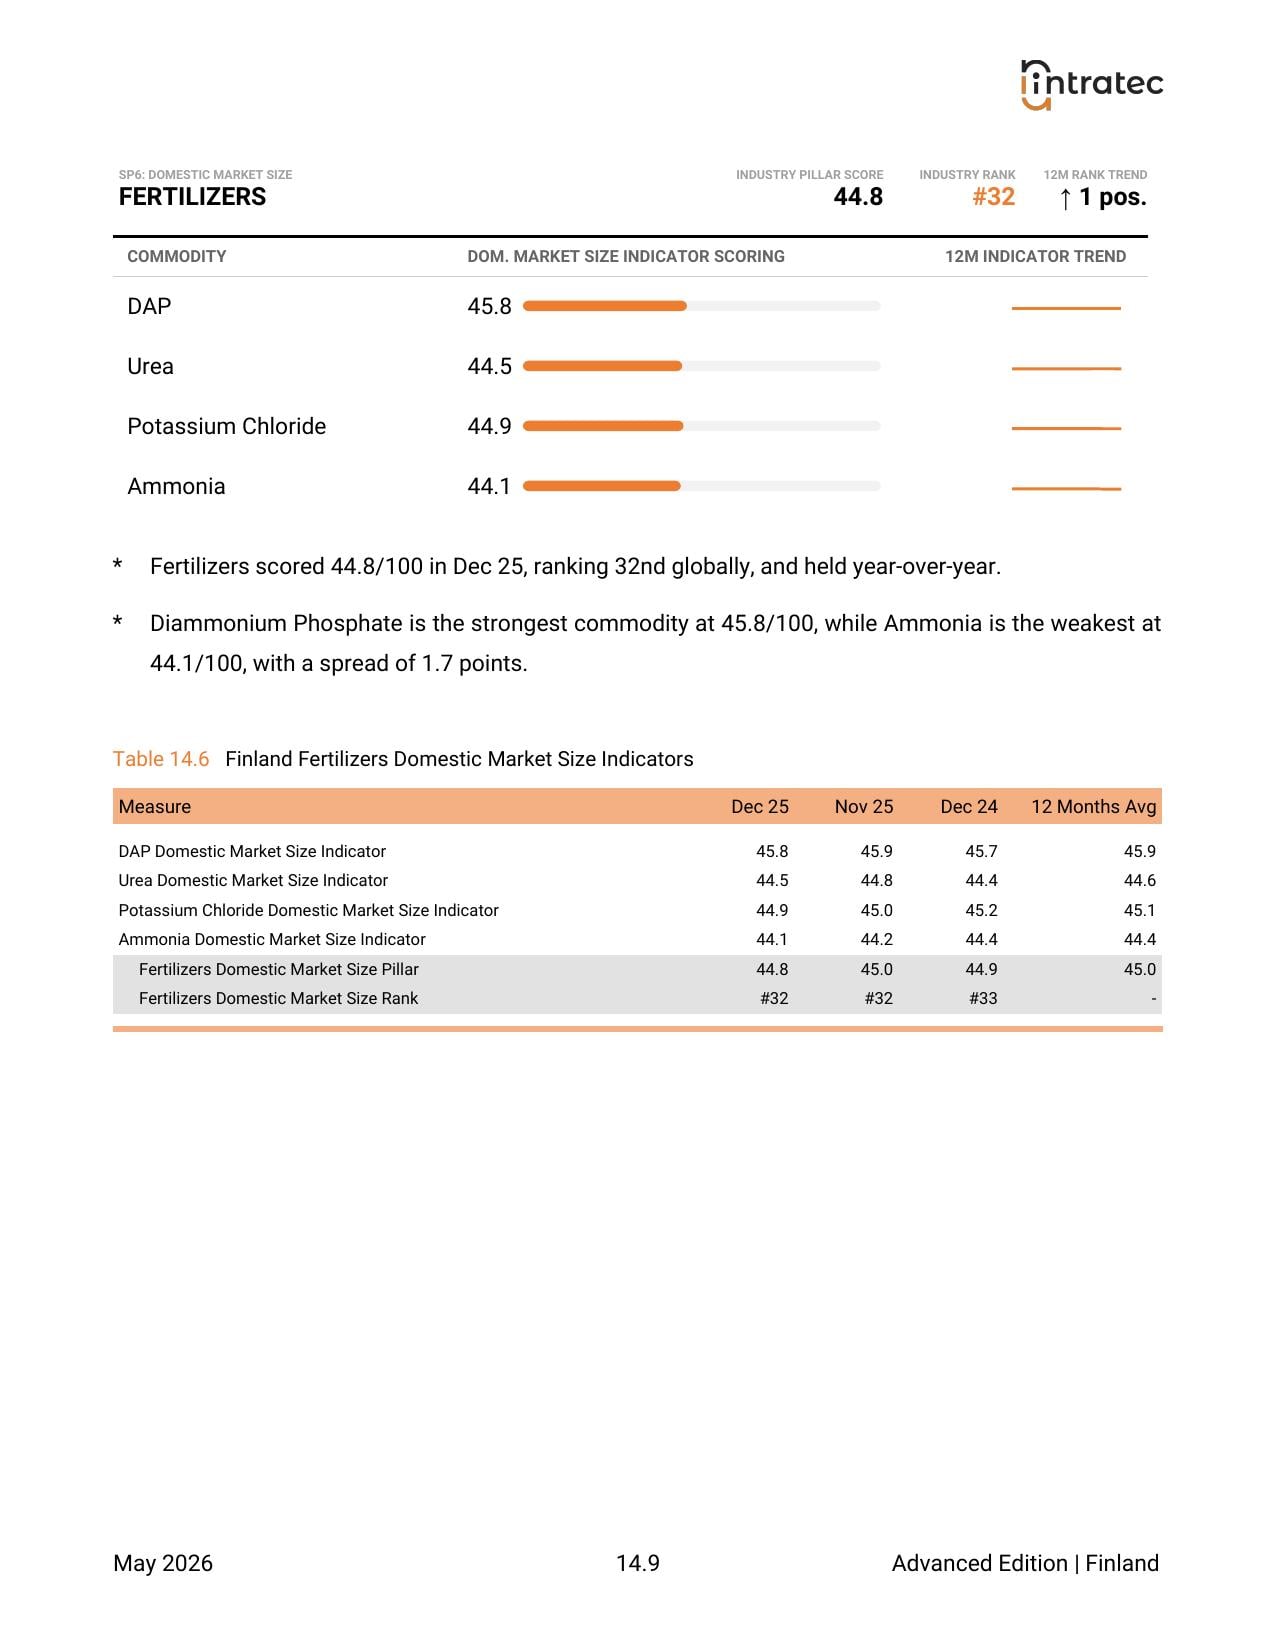
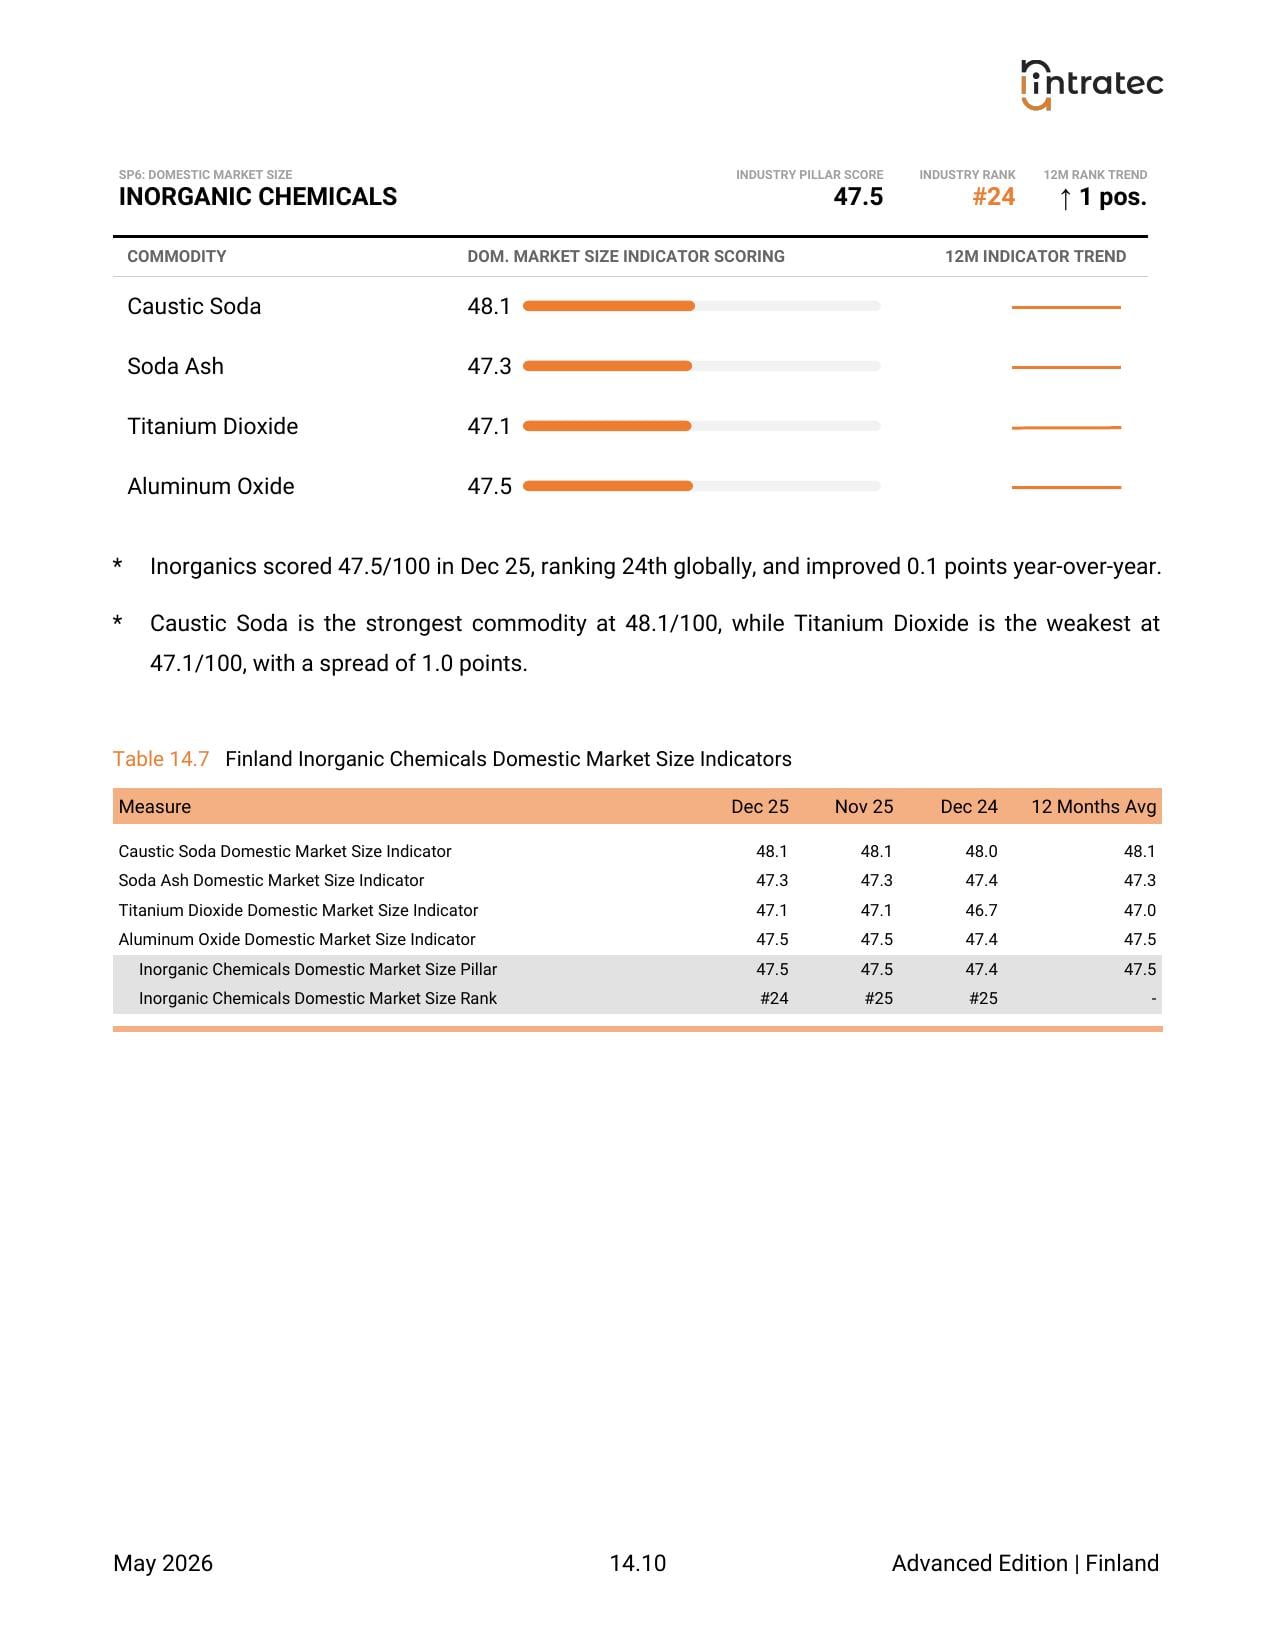
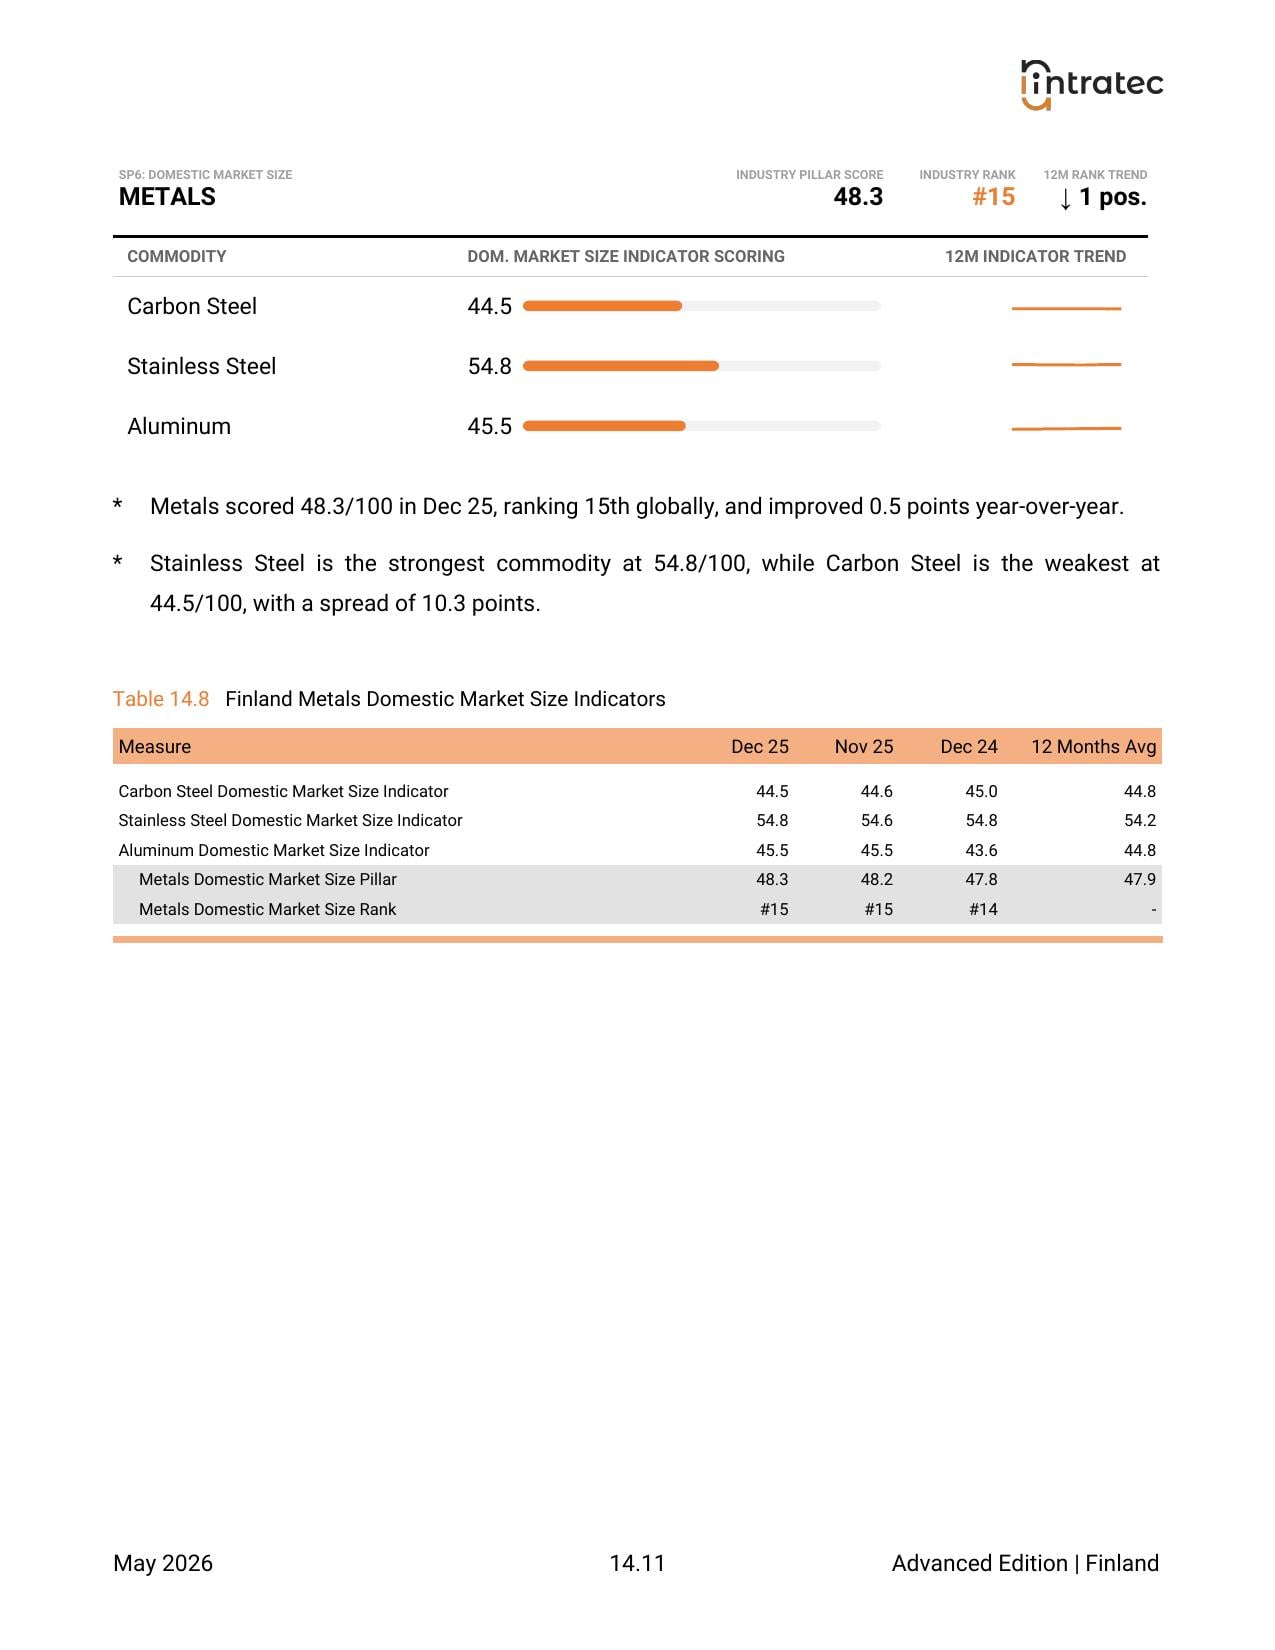
Domestic Market Size - Country Performance
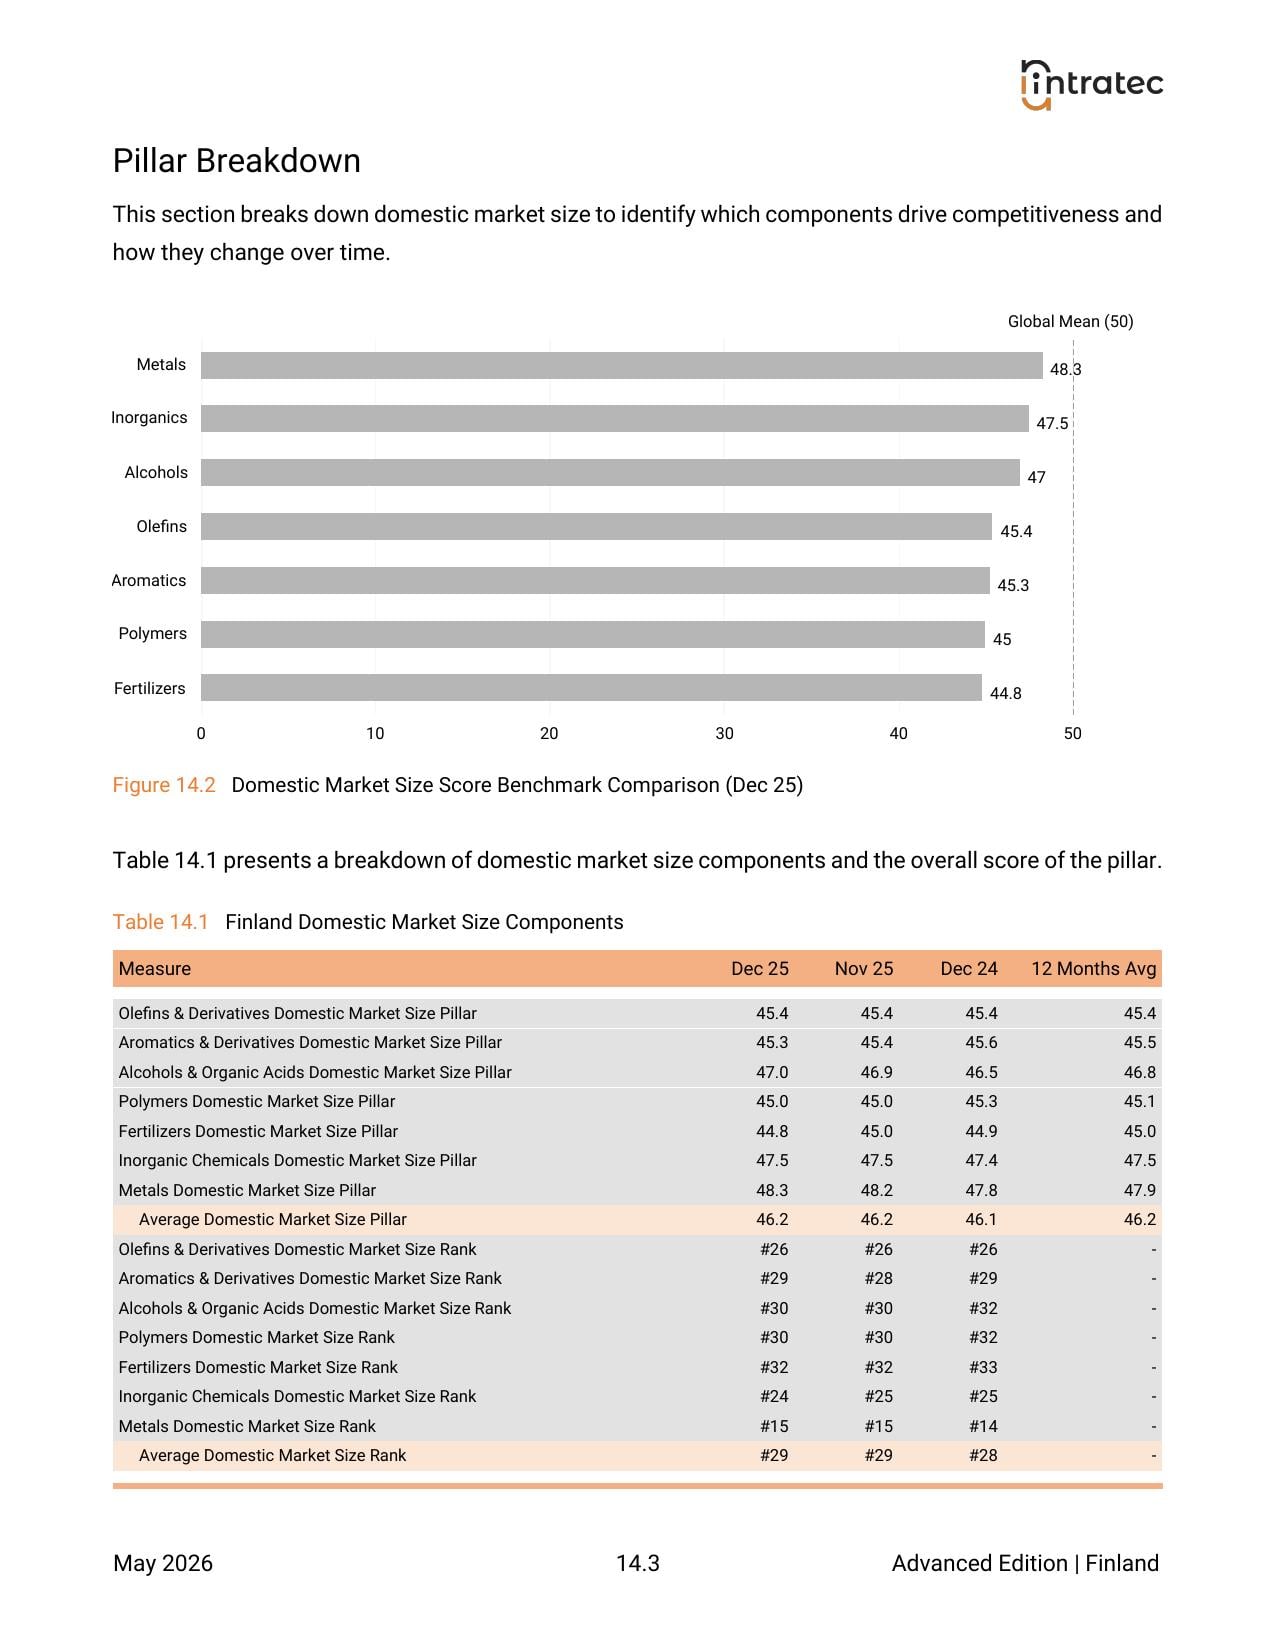
The country's overall market-size ranking, with per-sector standings showing how much it consumes domestically in each of the 7 industrial sectors.
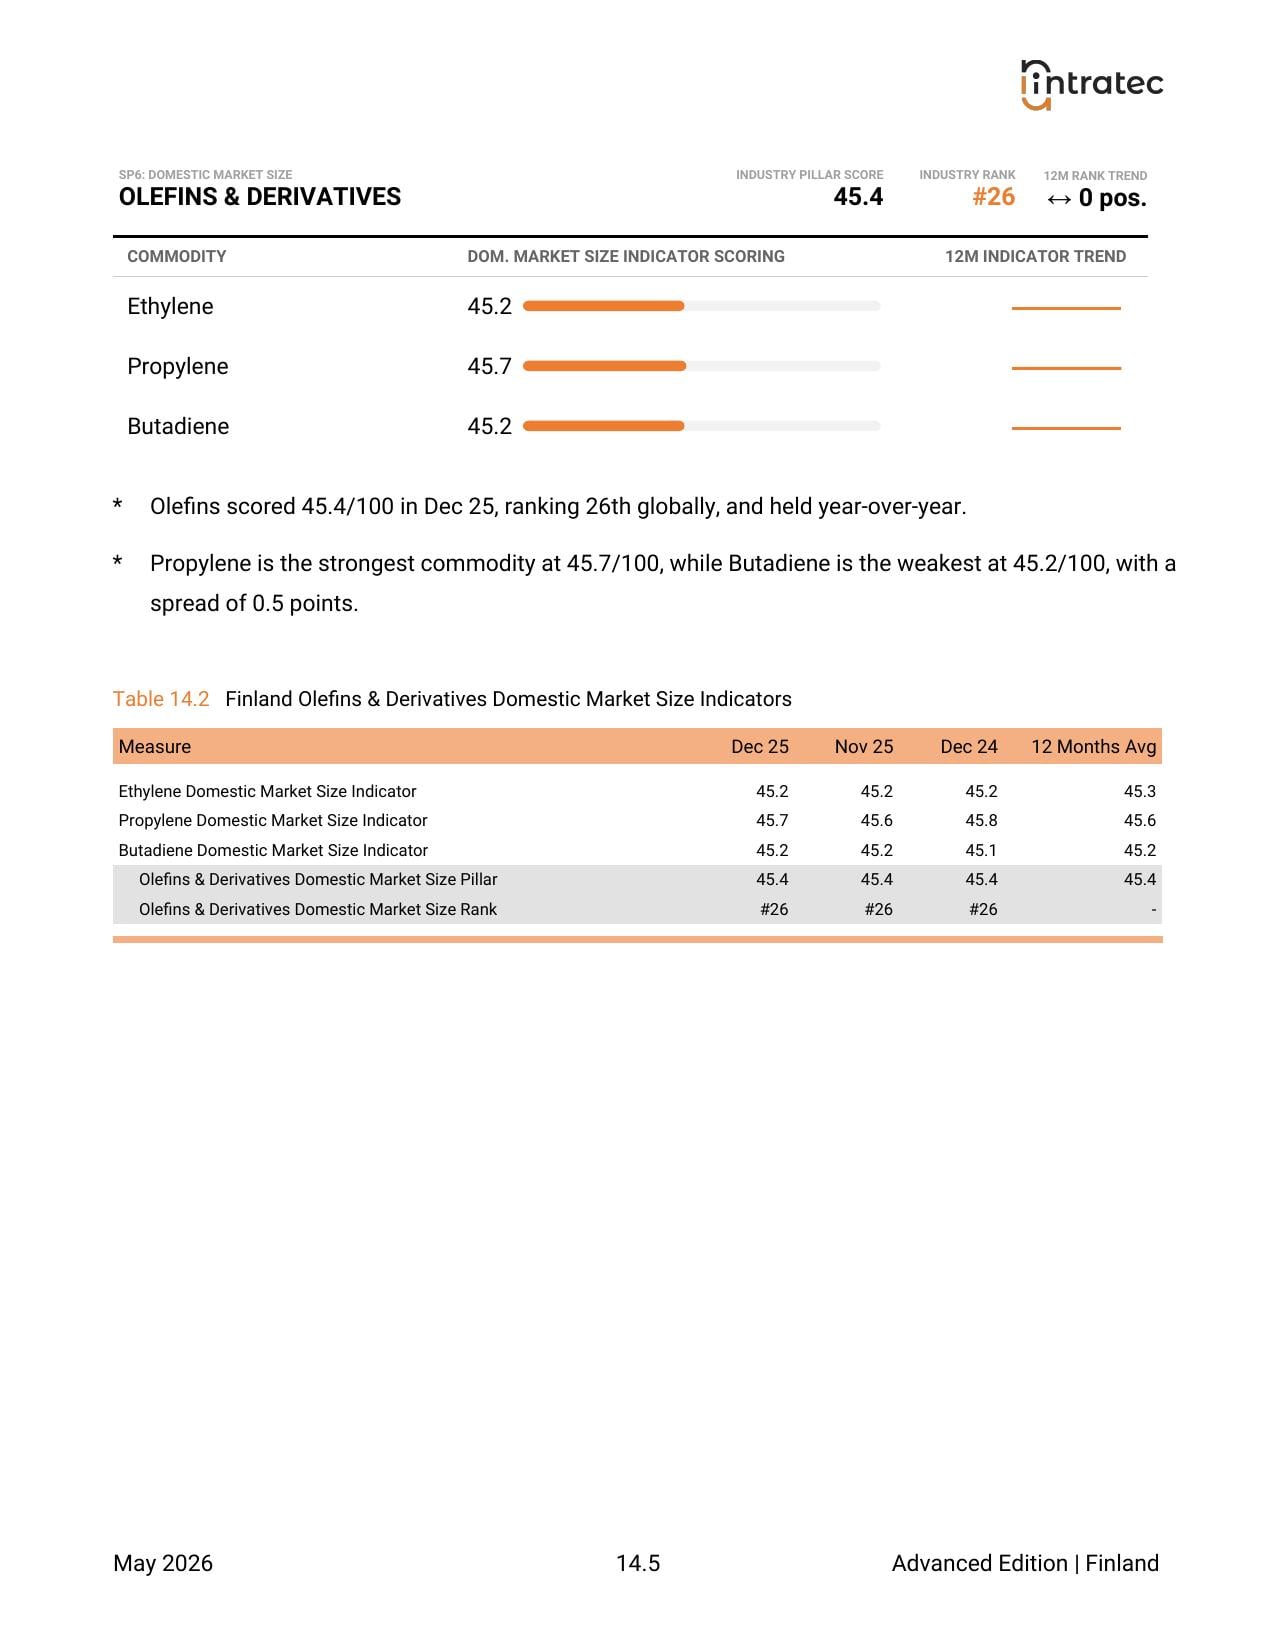
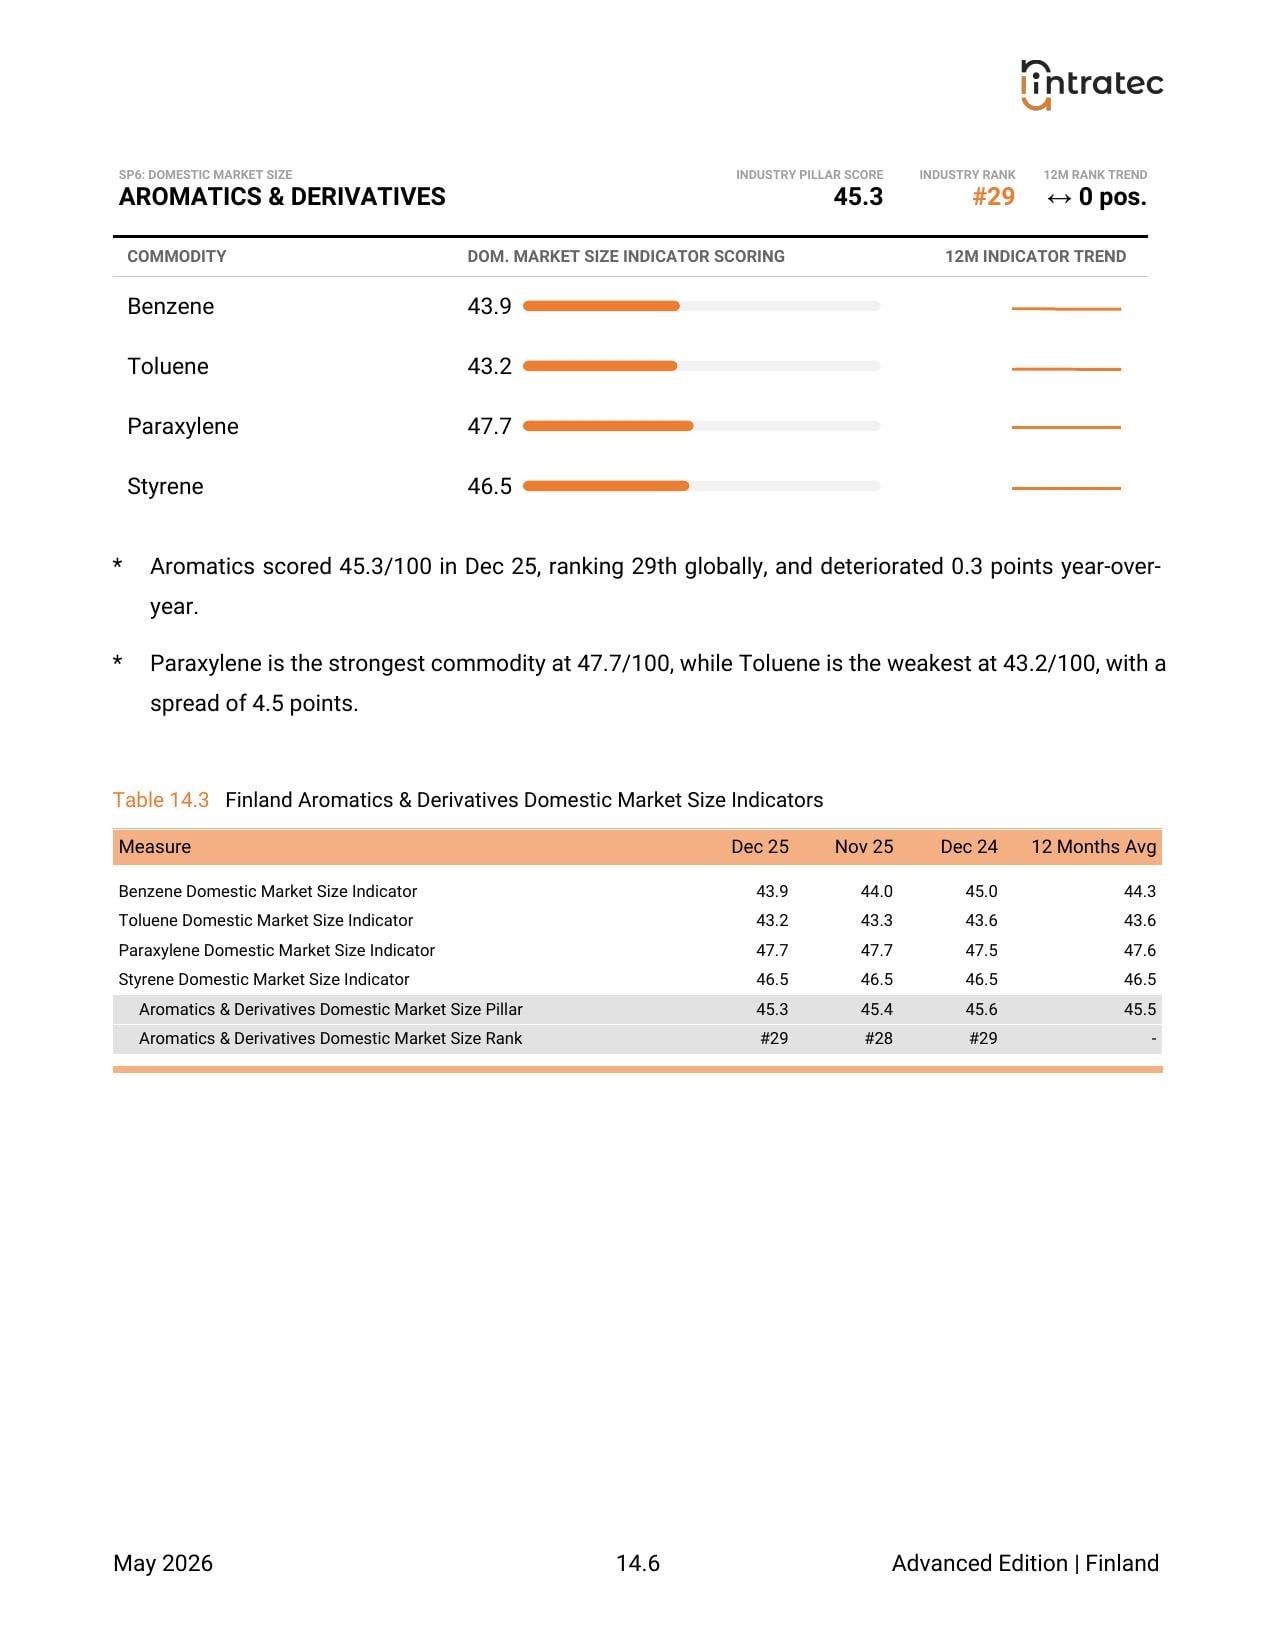
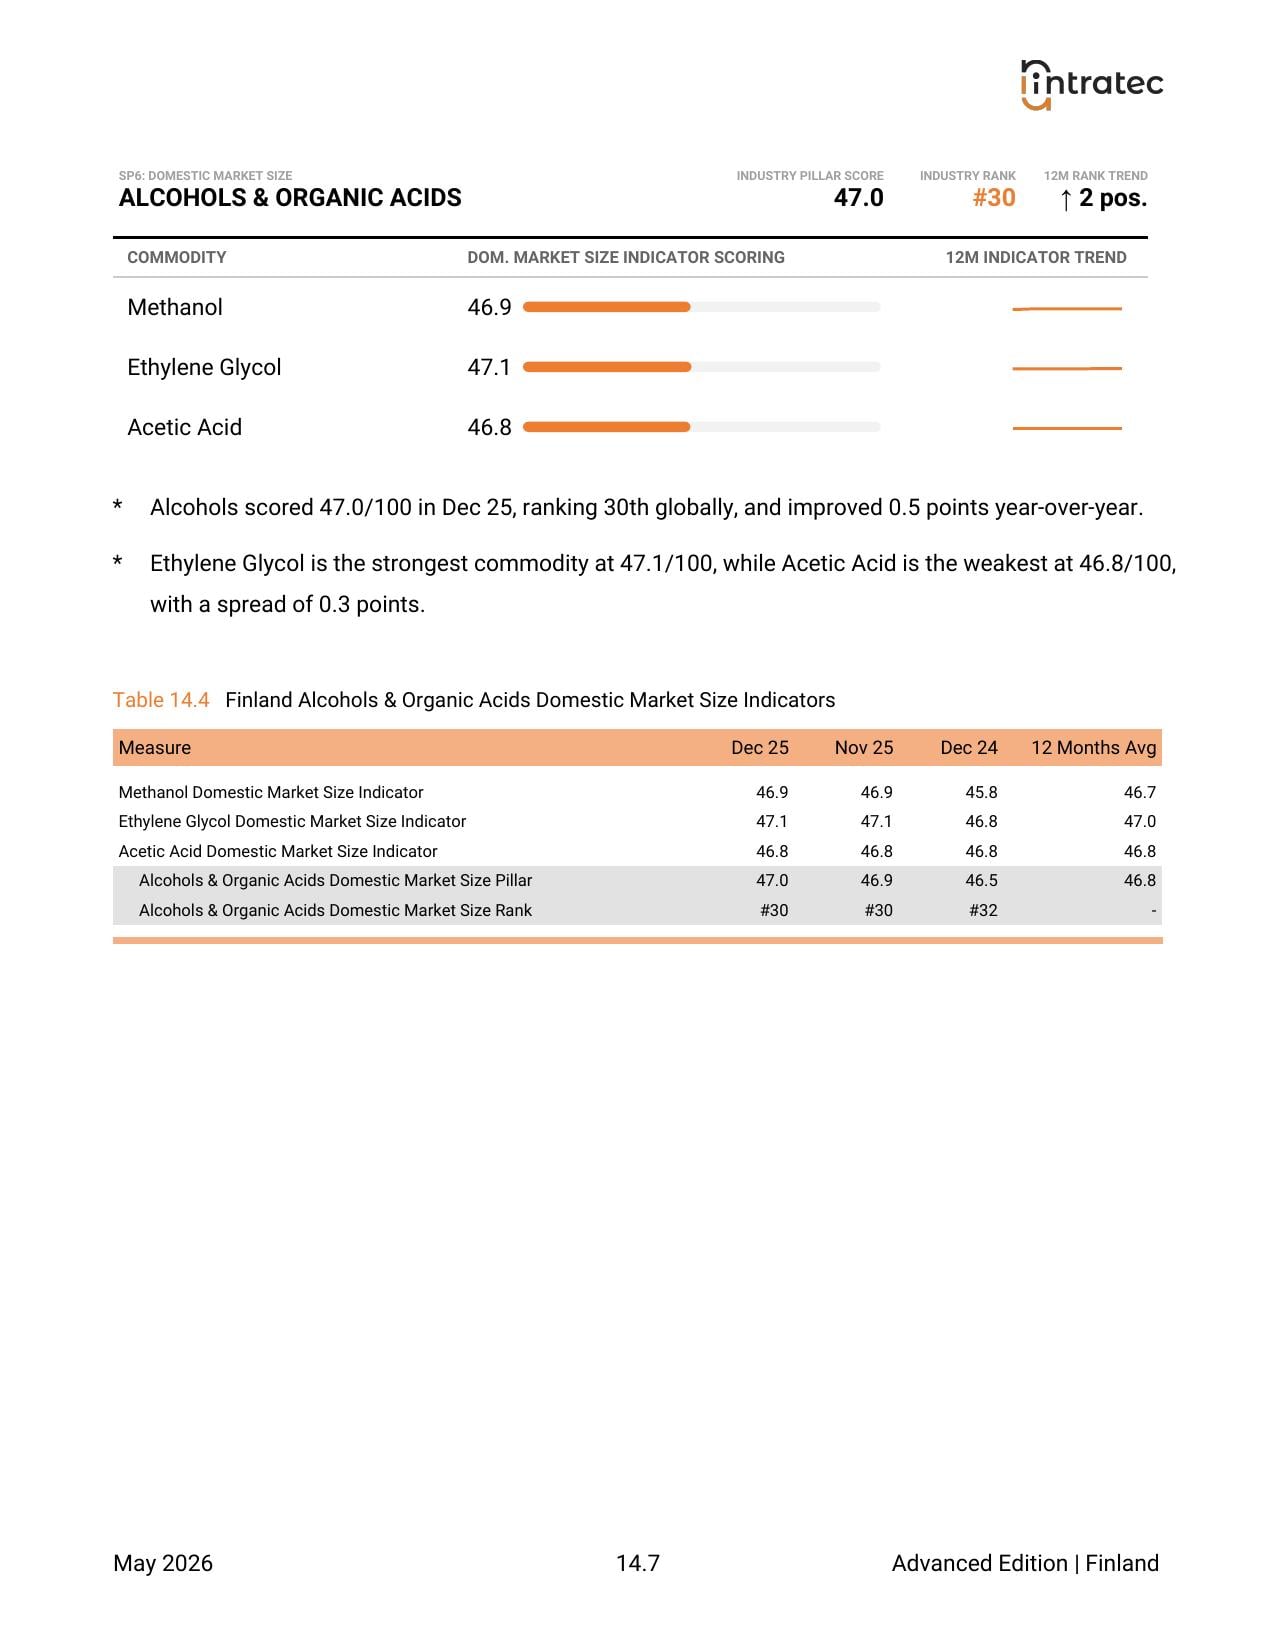
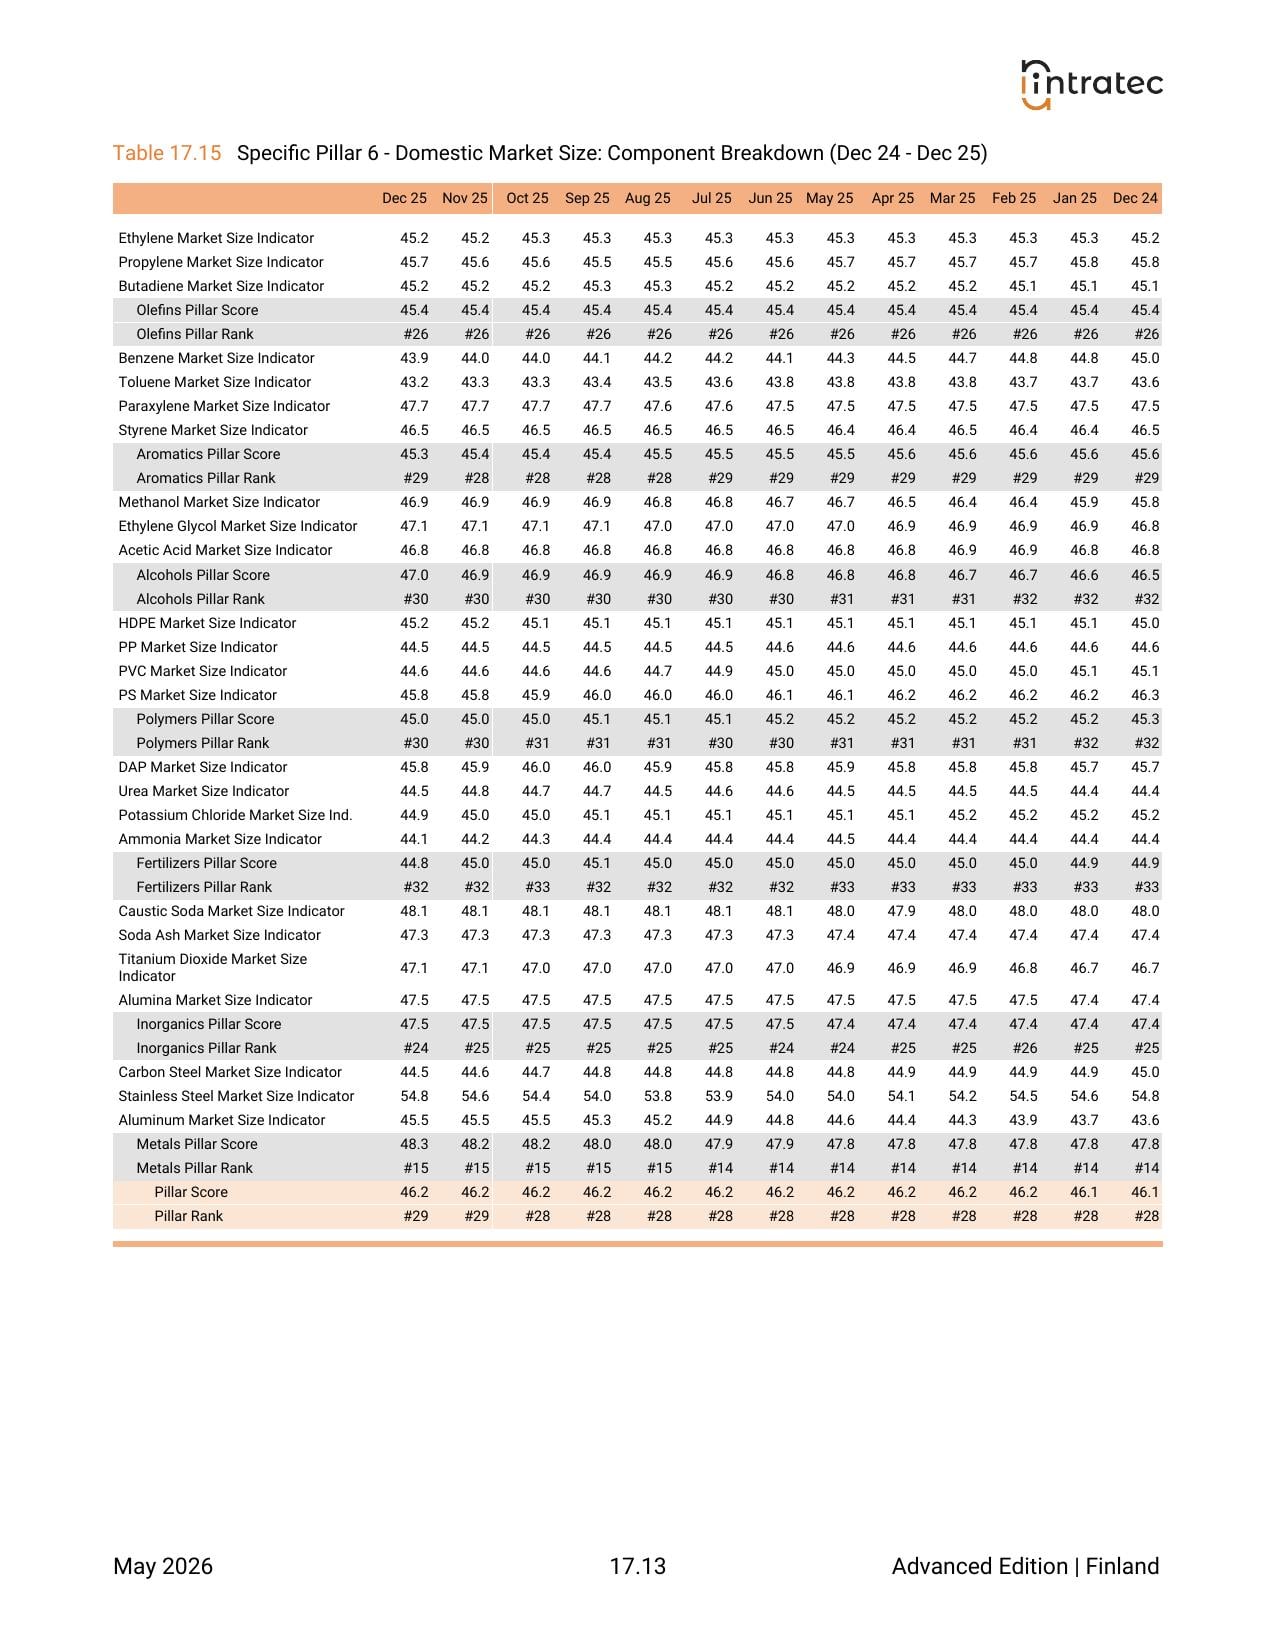
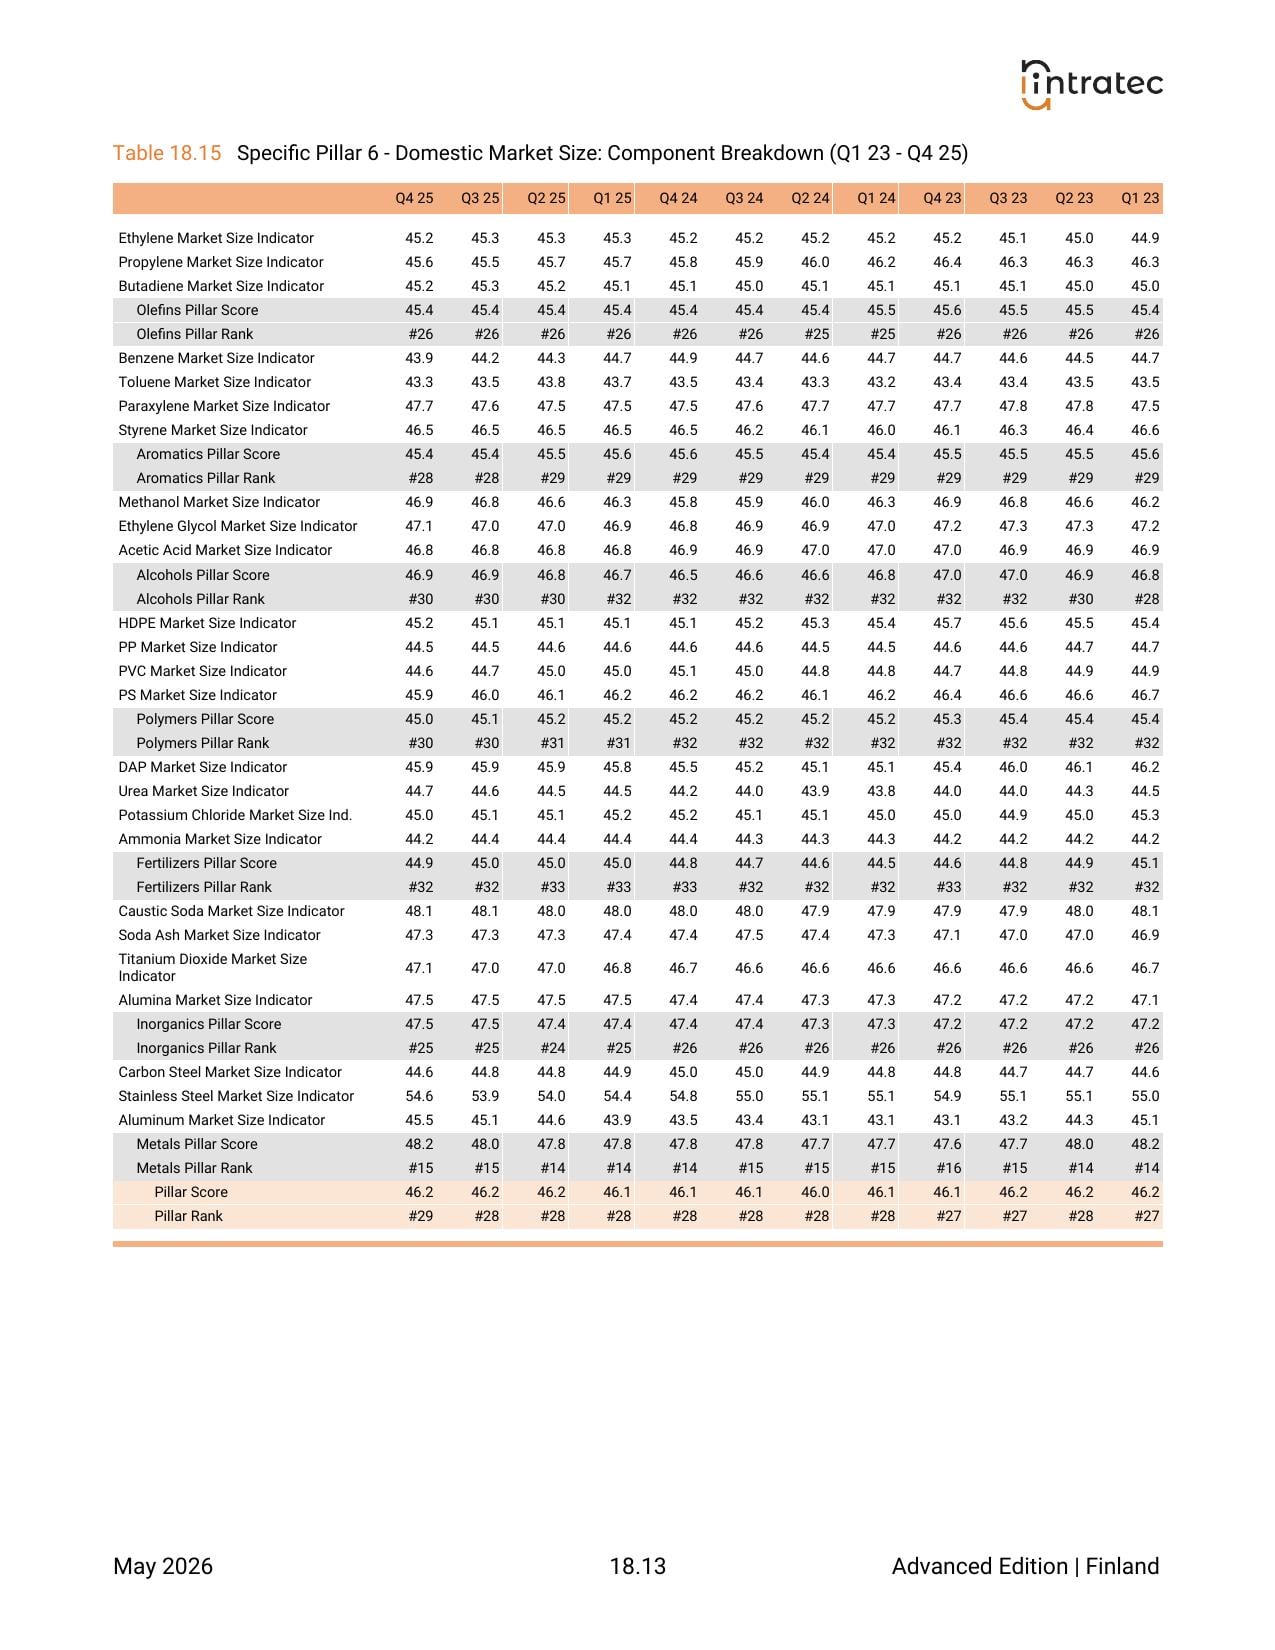
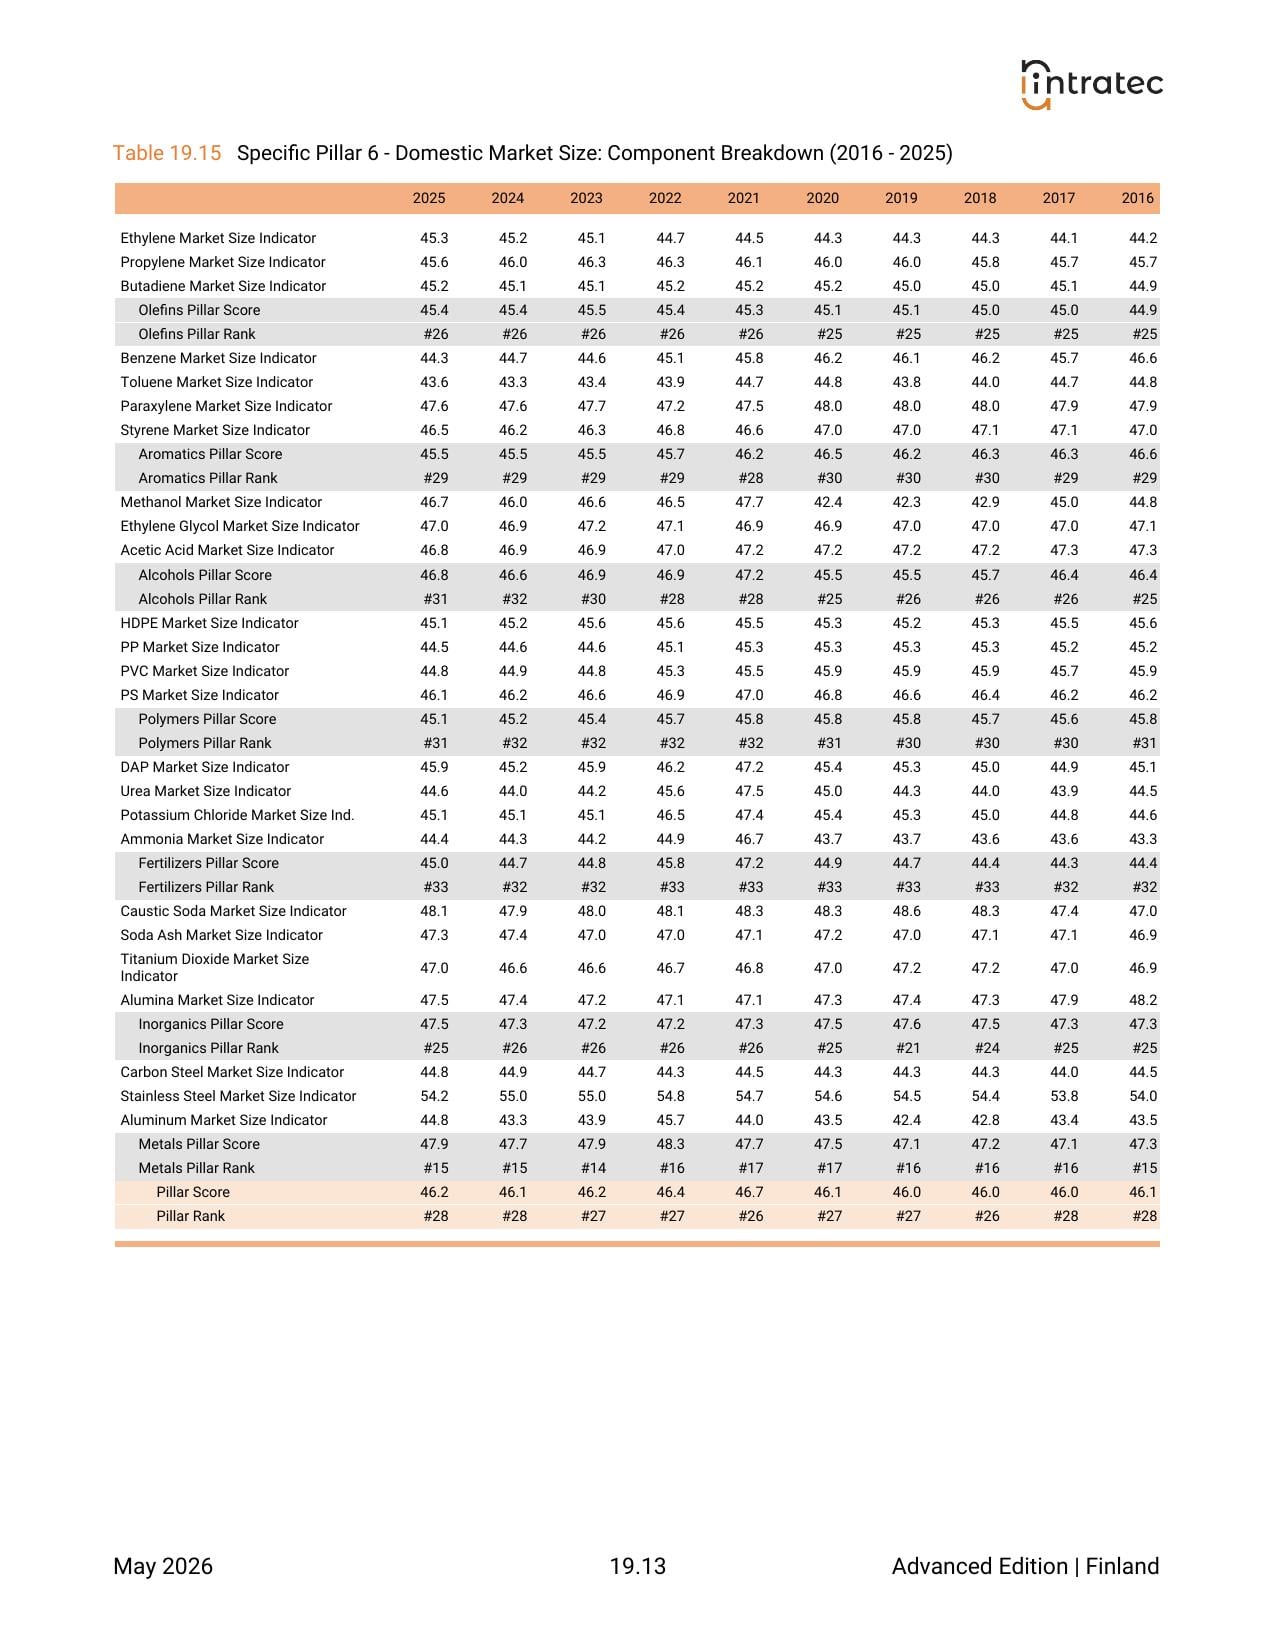
Domestic Market Size - Pillar Breakdown
Domestic-demand indicators for every commodity in the program, benchmarked globally, with demand trends across all 7 sectors over the past 12 months.
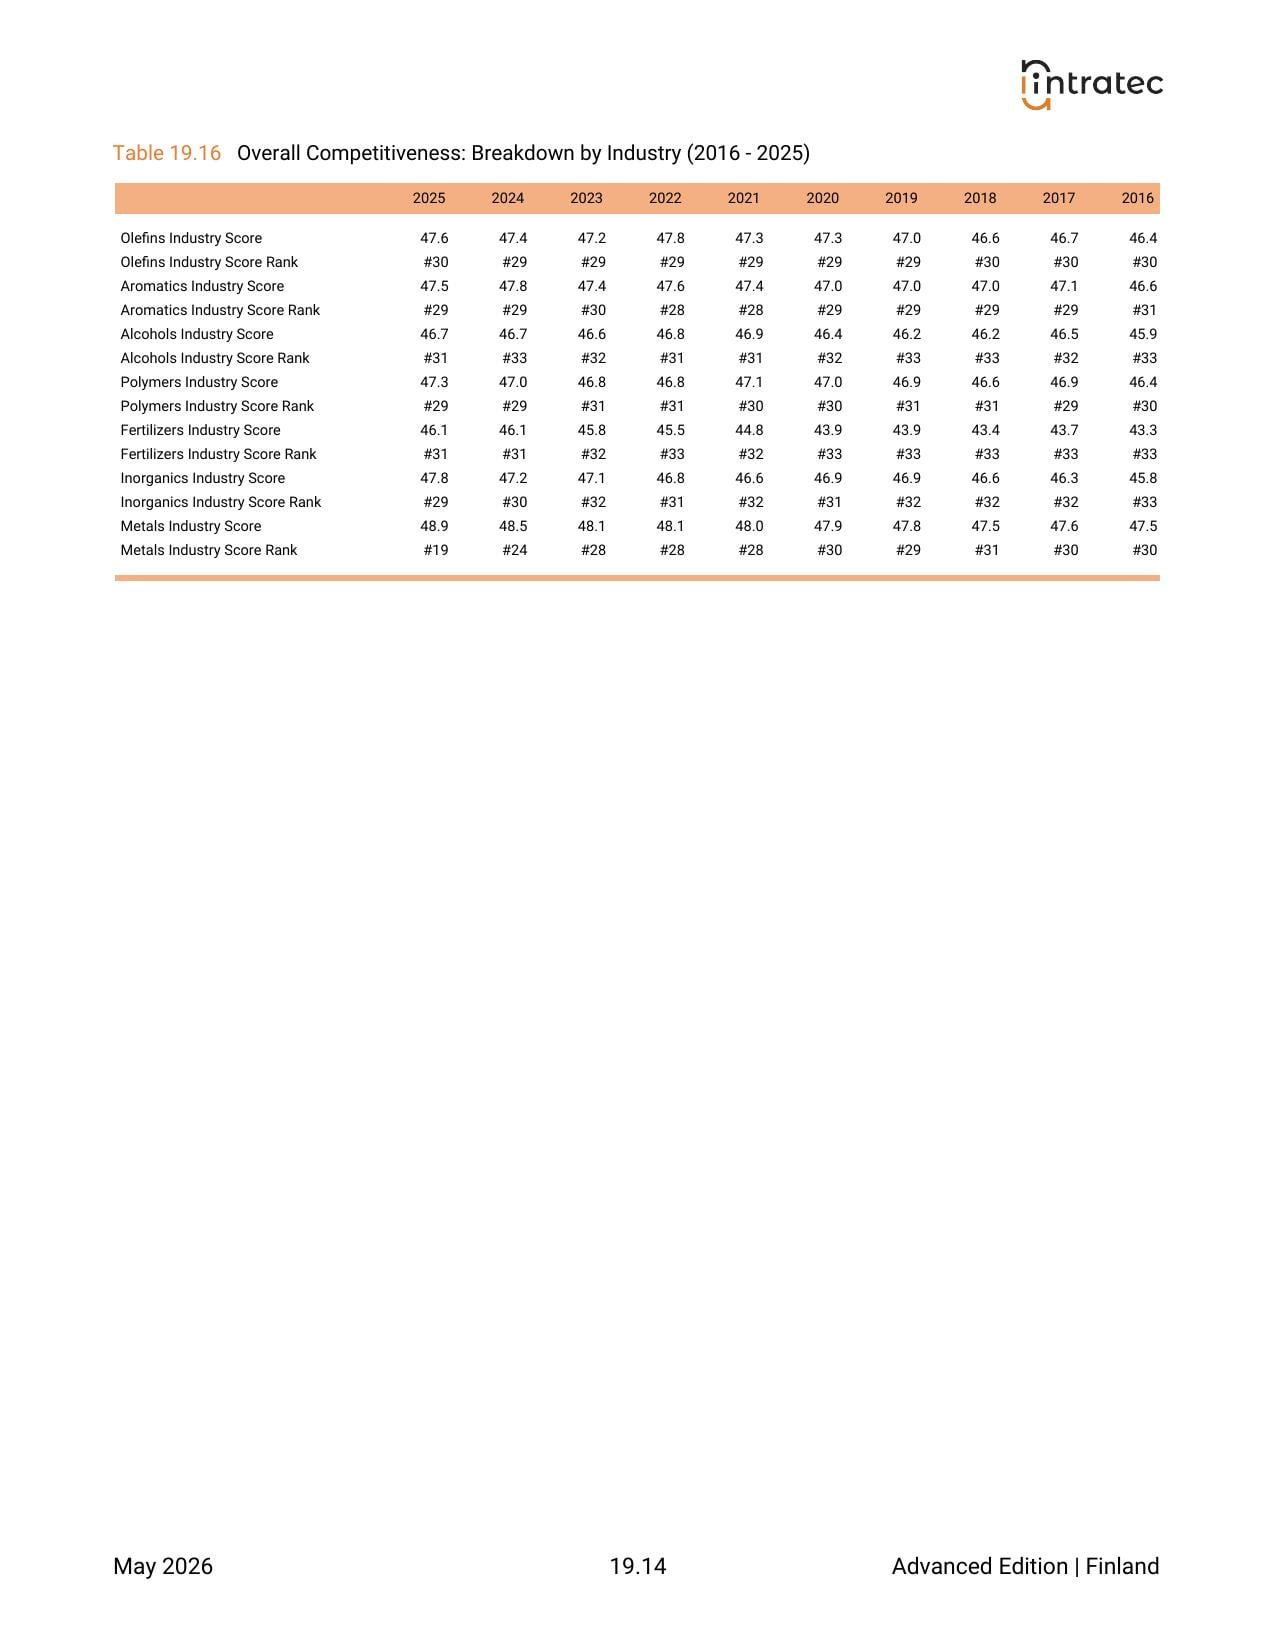
Country Overall Performance
The country's overall global ranking on industrial competitiveness, with how it has changed from last month and a year ago.
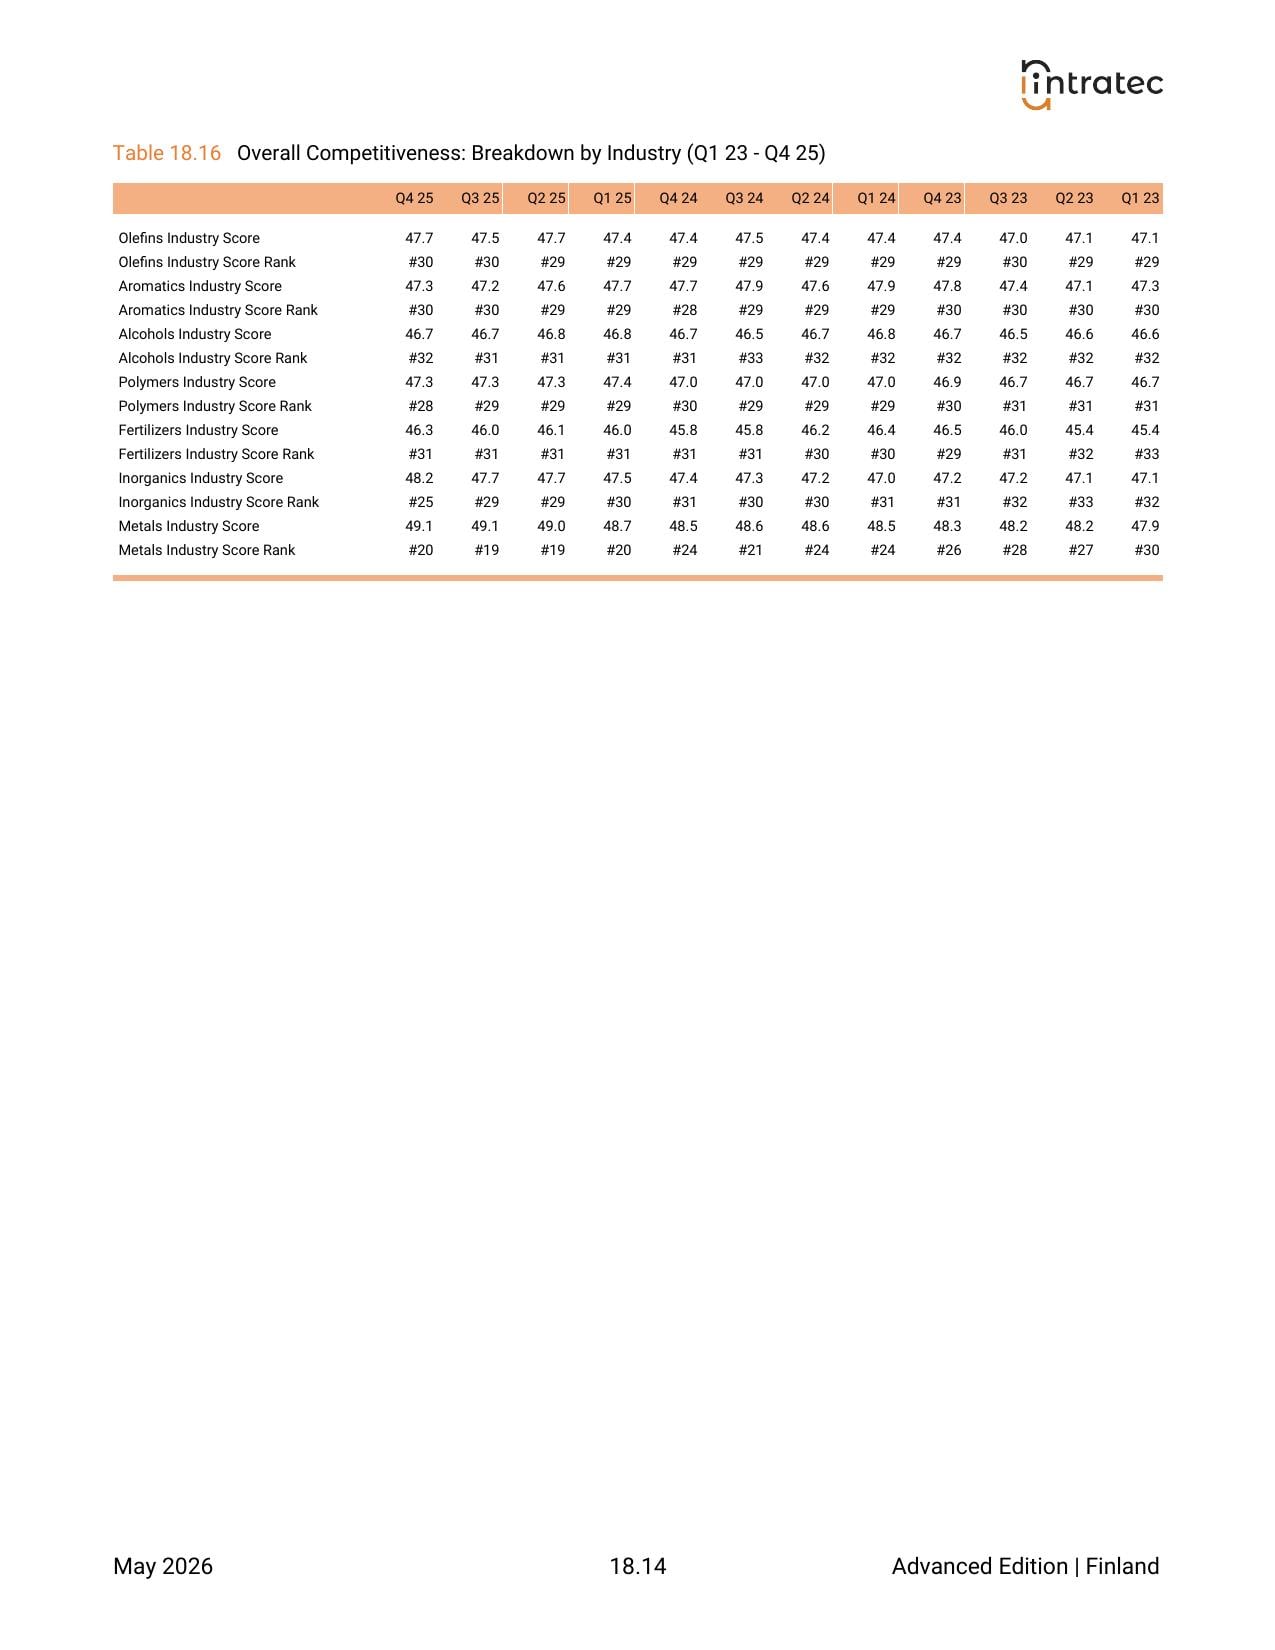
Industry Competitiveness Panorama
A dedicated section for each of the 7 industrial sectors — sector ranking, the contribution of each underlying pillar, year-over-year movement, and the competitive tier the country falls into.
Base Pillars Performance
A radar chart showing how the country compares with the global average across the 8 base pillars — making structural strengths and weaknesses visible at a glance.
1-Year Monthly History — Score & Rank
Monthly pillar scores and ranks for every one of the 14 pillars and for the overall competitiveness index, covering the past 12 months.
1-Year Monthly History — Component Breakdown
Monthly values for each underlying indicator behind every pillar — the raw cost, price, rate, or factor — covering the past 12 months.
3-Year Quarterly History — Score & Rank
Quarterly pillar scores and ranks for every pillar over the past 3 years, useful for spotting cyclical patterns.
3-Year Quarterly History — Component Breakdown
Quarterly values for each underlying indicator behind every pillar over the past 3 years.
10-Year Annual History — Score & Rank
Annual pillar scores and ranks for every pillar over the past 10 years, revealing long-term structural shifts.
10-Year Annual History — Component Breakdown
Annual values for every underlying indicator behind each pillar over the past 10 years. Monthly history of the full series is also available through the Excel Add-in, Power BI connector, and REST API.
Plant Construction Cost Indexes (IC Index)
A monthly index (Jan 2000 = 100) tracking how plant construction costs have evolved in this country, with detail by component — equipment, buildings, labor, engineering — and a 6-month forecast.
Plant Location Factors (IL Factors)
Dimensionless multipliers that adjust a plant construction cost estimate prepared for one country to any of the other 32 countries in the program — with monthly history and worked examples.
Labor Costs & Productivity Factors
Monthly hourly costs (total employer cost) for 4 industrial roles — plant operator, supervisor, manufacturing labor, and construction labor — alongside the productivity factors that go with each.
Industrial Utility Costs
Monthly unit costs for 12 industrial utilities a plant typically uses — steam at high, medium, and low pressure, process and atmospheric gases, and water services — with history and a 6-month forecast.