logo logo
  • Solutions
    • Primary Commodity Prices
    • Energy Prices & Markets
      • Content In Detail
    • Commodity Production Costs
      • Commodity Production Costs Report Content
      • Features
    • Industry Economics & Competitiveness
  • Coverage
    • Themes Covered
      • Current & Historical Prices
      • Price Forecasts
      • Capital Costs
      • Operating Costs
      • Markets & Trade
      • Manufacturing Competitiveness
    • Industries Covered
      • Oil & Energy
      • Fertilizers & Gases
      • Olefins & Derivatives
      • Aromatics & Derivatives
      • Alcohols & Organic Acids
      • Inorganic Chemicals
      • Polymers
      • Food & Nutrition
      • Metals & Mining
      • Pharmaceuticals
      • Water & Utilities
  • Data Delivery
    • Online Charts
    • Excel
    • Power BI
    • PDF Reports
    • Developer API
  • Plans & Pricing
  • Customers
    • People We Serve
      • Procurement & Supply Chain
      • Sales & Commercial
      • Strategy & Planning
      • Cost Analysts
      • R&D Professionals
      • Policymakers
      • Information Providers
    • Companies We Serve
      • Oil, Energy & Utilities
      • Basic Chemicals
      • Specialty Chemicals
      • Industrial Goods
      • Engineering & EPC
      • Trading & Distribution
      • Banks & Finance
      • Academia & NGOs
      • Information Providers
    • Overview
    • Culture
    • Media Kit
    • Careers
  • Support
    • Help Center
    • Methodologies
    • Release Notes
    • Release Schedule
    • Knowledge Base
    • Intratec News
    • Videos
    • Contact
    • Cookie Policy
    • Privacy Policy
    • Invoices
    • Quotes
    • Subscription Renewal
  • OC
  • 0
  • Log in
  • Log in

Plant Construction Cost Indexes

Update industrial plant construction costs over time using monthly country-level indexes.

Plant Construction Cost Indexes (IC Indexes) are multipliers used to adjust the construction cost of industrial plants from one period to another. In other words, each IC Index is a monthly series that measures changes in the capital expenditure (capex) required to build a commodities manufacturing plant in a given country, helping users bring past capital-cost estimates to current or forecast periods.

IC Indexes are part of Intratec Industry Economics & Competitiveness, an annual subscription program that delivers monthly country-level reports and reference datasets for benchmarking commodities manufacturing competitiveness across 33 countries.
See Full Sample

Full Sample Report
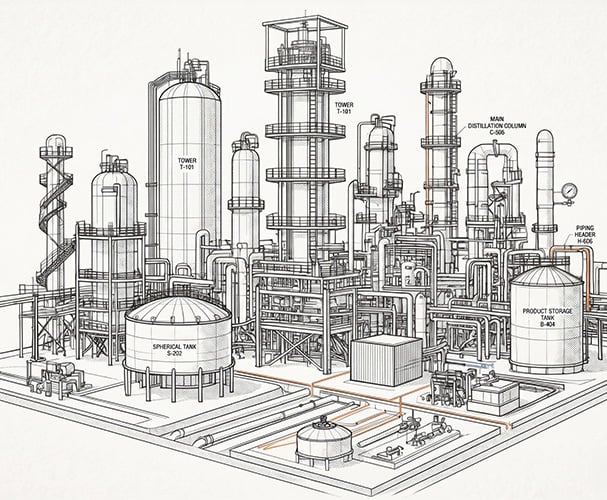
Industry Sketch

Using Plant Construction Cost Indexes

Adjusting a past construction cost to a current cost level takes a single multiplication.

Formula

Adjusted Cost =

Original Cost ×
IC Index [target date] IC Index [original date]

Example — Polypropylene plant, United States

A plant built in the United States in January 2017 cost USD 350 million. Adjusting that figure to February 2025 — using the US IC Index value at each date — gives:

Adjusted Cost = USD 350M × ( 202.7 / 142.7 ) = USD 497M

Works for any of the 33 countries — every IC Index shares the same January 2000 = 100 base.

Preview Construction Cost Indexes

Each preview shows the country's IC Index as a monthly chart.

portfolio-img

United States

portfolio-img

Australia

portfolio-img

Belgium

portfolio-img

Brazil

portfolio-img

Canada

portfolio-img

Chile

portfolio-img

China

portfolio-img

Colombia

portfolio-img

Czech Republic

portfolio-img

Finland

portfolio-img

France

portfolio-img

Germany

portfolio-img

Hungary

portfolio-img

India

portfolio-img

Indonesia

portfolio-img

Italy

portfolio-img

Japan

portfolio-img

Mexico

portfolio-img

Netherlands

portfolio-img

Norway

portfolio-img

Philippines

portfolio-img

Poland

portfolio-img

Russia

portfolio-img

Saudi Arabia

portfolio-img

Singapore

portfolio-img

South Africa

portfolio-img

South Korea

portfolio-img

Spain

portfolio-img

Sweden

portfolio-img

Taiwan

portfolio-img

Thailand

portfolio-img

Turkey

portfolio-img

United Kingdom

Translating Costs Across Countries — Plant Location Factors

If the IC Index moves a plant's cost forward in time within one country, Plant Location Factors (IL Factors) move it sideways across countries. Each country's report carries 32 IL Factors — one for every peer country — with the report country itself as the baseline (= 1.00). Multiplying a peer-country plant cost by the corresponding IL Factor gives the equivalent cost in the report country.

Formula

Equivalent Cost =

Reference Cost ×
IL Factor [target] IL Factor [reference]

Example — US plant cost ported to Germany

A polypropylene plant in the United States costs USD 500 million. Germany's IL Factor is 1.13, USA's is 1.00:

Equivalent Cost = USD 500M × ( 1.13 / 1.00 ) = USD 565M

Works between any pair of the 33 countries — every IL Factor sits on the same USA = 1.00 base.

Beyond Construction Cost Indexes

Plant Construction Cost Indexes and Plant Location Factors are among the reference datasets delivered inside the Industry Economics & Competitiveness subscription — a monthly program benchmarking commodities manufacturing competitiveness across 33 countries.

Explore this Solution

33 Key Countries

Country-by-country monthly reports covering major industrial hubs — USA, China, Germany, Japan, Brazil, India, and more.

7 Industries Covered

Industry-specific rankings across olefins, aromatics, alcohols & organic acids, polymers, fertilizers, inorganic chemicals, and metals.

Reference Datasets

Country-level cost inputs for plant projects — labor costs, utility prices, construction indexes, and location factors.

Monthly Updates

Fresh data every month, always reflecting the most recent period available, with short-term forecasts on selected series.

Main Menu
    • Primary Commodity Prices
    • Energy Prices & Markets
    • Commodity Production Costs
    • Industry Economics & Competitiveness
      • Current & Historical Prices
      • Price Forecasts
      • Capital Costs
      • Operating Costs
      • Markets & Trade
      • Manufacturing Competitiveness
      • Oil & Energy
      • Fertilizers & Gases
      • Olefins & Derivatives
      • Aromatics & Derivatives
      • Alcohols & Organic Acids
      • Inorganic Chemicals
      • Polymers
      • Food & Nutrition
      • Metals & Mining
      • Pharmaceuticals
      • Water & Utilities
    • Online Charts
    • Excel
    • Power BI
    • PDF Reports
    • Developer API
  • Plans & Pricing
      • Procurement & Supply Chain
      • Sales & Commercial
      • Strategy & Planning
      • Cost Analysts
      • R&D Professionals
      • Policymakers
      • Information Providers
      • Oil, Energy & Utilities
      • Basic Chemicals
      • Specialty Chemicals
      • Industrial Goods
      • Engineering & EPC
      • Trading & Distribution
      • Banks & Finance
      • Academia & NGOs
      • Information Providers
    • Help Center
    • Methodologies
    • Release Notes
    • Release Schedule
    • Knowledge Base
    • Intratec News
    • Videos
    • Contact
  • 0
  • Log in
Shopping Cart
logo logo

21750 Hardy Oak Blvd, Suite 104

San Antonio, TX 78258-4946 USA

Supporter of the Focus Foundation

Solutions
  • Primary Commodity Prices
  • Energy Prices & Markets
  • Production Cost Reports
  • Industry Economics Worldwide
Quick links
  • About us
  • Contact us
  • Career
  • Culture
  • Media Kit
  • Systems Status
Resources
  • Help Center
  • Methodologies
  • Release Notes
  • Release Schedule
  • Knowledge Base
  • Intratec News

Copyrights ©2002-2026 Intratec Solutions, LLC. All Rights Reserved | Privacy Policy | Privacy Policy
©2002-2026 Intratec Solutions, LLC. All Rights Reserved | Cookie Policy | Privacy Policy | Terms & Conditions