Commodity Production Costs Report
Allyl Chloride Production
Allyl Chloride Plant Capital & Operating Cost Analysis | United States | Q1 2026

This report presents the economics of Allyl Chloride production from chlorine and propylene. The process examined is a typical chlorination process. In this process, propylene is reacted with chlorine, yielding Allyl Chloride product. Hydrogen chloride (32 wt%) is generated as by-product.
The report provides a comprehensive study of Allyl Chloride production and related Allyl Chloride production cost, covering three key aspects: a complete description of the Allyl Chloride production process examined; an in-depth analysis of the related Allyl Chloride plant capital cost (Capex); and an evaluation of the respective Allyl Chloride plant operating costs (Opex).
The Allyl Chloride production process description includes a block flow diagram (BFD), an overview of the industrial site installations, detailing both the process unit and the necessary infrastructure, process consumption figures and comprehensive process flow diagrams (PFD). The Allyl Chloride plant capital cost analysis breaks down the Capex by plant cost (i.e., ISBL, OSBL and Contingency); owner's cost; working capital; and costs incurred during industrial plant commissioning and start-up. The Allyl Chloride plant operating costs analysis covers operating expenses, including variable costs like raw materials and utilities, and fixed costs such as maintenance, labor, and depreciation.
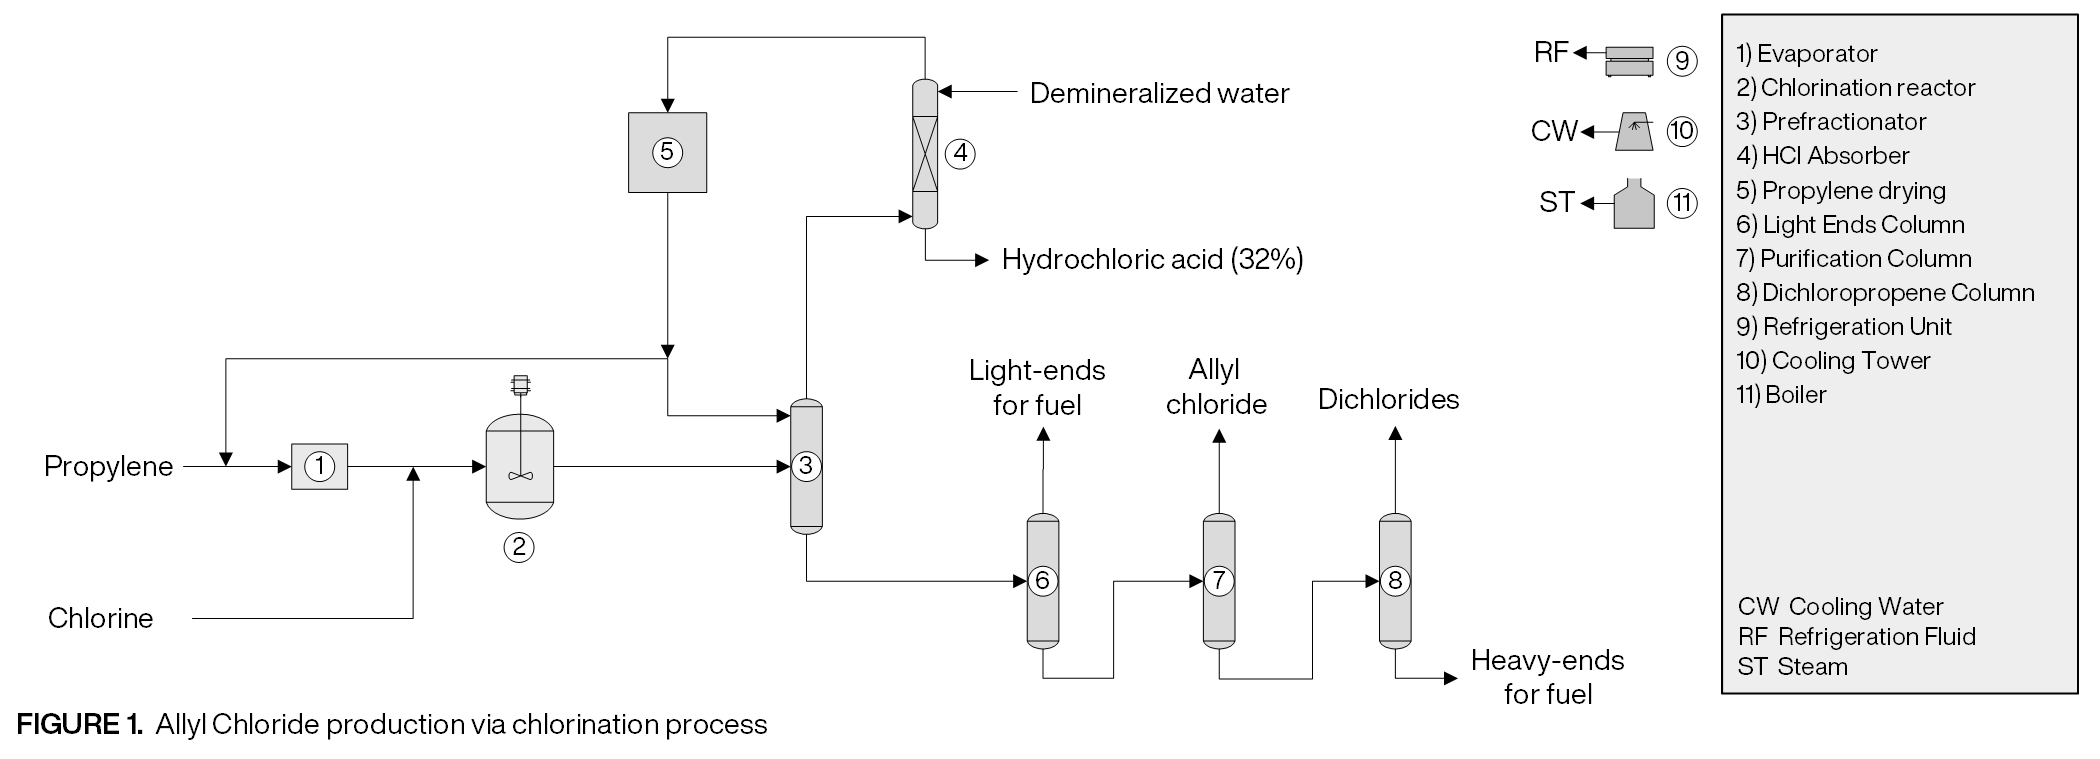
The process under analysis comprises three major sections: (1) Chlorination; (2) Propylene Recovery; and (3) Product Treatment.
Chlorination. The liquid propylene is sent to an evaporator, being vaporized and preheated to the chlorination reaction temperature. It is then fed, along with chlorine, to an adiabatic reactor, where the chlorination reaction is carried out, producing allyl chloride and by-products.
Propylene Recovery. The reactor effluent is cooled and routed to the Prefractionator, where HCl and unreacted propylene are separated from chloropropenes, dichloropropenes, chloropropanes and heavier compounds. The Prefractionator overhead stream, containing HCl and propylene, is passed in countercurrent with demineralized water in the HCL Absorber, forming a hydrochloric acid solution with 32% purity that is stored. The off-gas, mostly propylene, is sent to Caustic Wash, which removes residual HCl. The washed propylene is compressed and routed to a decanter and dried by adsorption for water removal. Part of dried propylene is returned to the feed, and the remainder is recycled to the Prefractionator.
Product Treatment. The bottom stream from the Prefractionator, rich in Allyl Chloride, is directed to the Light-ends Column, which strips components lighter than Allyl Chloride, that are burned for fuel. The bottom product of this column is sent to the Purification Column, where Allyl Chloride is removed form the top, condensed and routed to storage, while its bottom is sent to Dichloropropene Column. This last distillation step separates dichlorides, collected from the top and sent to storage, from heavy components that are burned for fuel.
Report in PDF Format
Download & Explore Anytime
Access in Various Devices
Print & Read Comfortably
Share With Co-workers
Up-to-date Report
Professional report based on Q1 2026 economic data, ensuring timely evaluations.
Multiple Use Cases
Ideal for investment screening, feasibility studies, cost estimates, and research planning.
Proven Methodology
Developed using a consistent methodology honed over a decade, ensuring reliable cost analyses.
What You Get in Each Report
Behind every cost estimate is a structured view of the process, its requirements, and the economics of building and operating the plant.
Plant Capital Cost Summary
Capital cost required to build the plant examined.
Plant Capital Cost Details
Fixed capital (ISBL, OSBL, and owner's cost), working capital, and additional capital requirements.
Plant Cost Breakdowns
Process unit (ISBL) and infrastructure (OSBL) costs, plus a plant cost breakdown by discipline.
Operating Costs Summary
Variable costs and the total operating cost of the plant studied.
Operating Cost Details
Utilities costs, operating fixed costs, and depreciation.
Plant Capacity Assessment
Capital investment and operating costs compared across different plant capacities.
Production Process Information
Block flow diagram, with descriptions of the process unit (ISBL) and site infrastructure (OSBL).
Process Consumptions
Raw materials and utilities consumption, by-product credits, and labor requirements.
Process Diagrams
Process flow diagrams (PFD), equipment list, and industrial site configuration.
Content Highlights
Plant Capital Cost Summary
Summary outlining the capital cost required for building the Allyl Chloride production plant examined.
Plant Capital Cost Details
Detailing of fixed capital (ISBL, OSBL & Owner’s Cost), working capital and additional capital requirements.
Plant Cost Breakdowns
Breakdown of Allyl Chloride process unit (ISBL) costs and infrastructure (OSBL) costs; plant cost breakdown per discipline.
Operating Costs Summary
Summary presenting the operating variable costs and the total operating cost of the Allyl Chloride production plant studied.
Operating Cost Details
Detailing of utilities costs, operating fixed costs and depreciation.
Plant Capacity Assessment
Comparative analysis of capital investment and operating costs for different Allyl Chloride plant capacities.
Production Process Information
Block Flow Diagram, descriptions of process unit (ISBL) and site infrastructure (OSBL).
Process Consumptions
Raw materials and utilities consumption figures, by-products credits, labor requirements
Process Diagrams
Process flow diagrams (PFD), equipment list and industrial site configuration
Preview our Production Cost Reports

Could Not Find the Report You Need?
Obtain a Bespoke Report
Get a report targeting the process in which you are interested
See Offer Details
Understand Bespoke Reports and how you can easily order them
Check Editions & Pricing
Complete a brief form and see a quotation for your Bespoke Report
Other Related Production Cost Reports

Propylene Production from Propane (Moving-Bed Reactor)
This study presents the economics of Polymer Grade (PG) Propylene production from propane. The process consists in the dehydrogenation of propane, carried out in a moving-bed reactor, similar to UOP Oleflex. The economic analysis performed assumes a plant located in the United States.
Details: 550 kta United States-based plant | Q1 2026 | 107 pages | Issue B | From $799 USD

Chlorine Production from Sodium Chloride (Diaphragm Process)
This study presents the economics of Chlorine production from sodium chloride via a diaphragm plant located in the United States. In the process under analysis, an aqueous solution of sodium chloride (brine) is decomposed electrolytically in a diaphragm cell, producing Chlorine, sodium hydroxide and hydrogen.
Details: 550 kta United States-based plant | Q1 2026 | 107 pages | Issue B | From $799 USD

Propylene Production from Ethylene and Butenes
This report presents the economics of Polymer Grade (PG) Propylene production from ethylene and raffinate-2. The process under analysis consists in a metathesis process similar to Lummus Technology's Olefins Conversion Technology (OCT). The economic analysis performed assumes a plant located in the United States.
Details: 350 kta United States-based plant | Q1 2026 | 107 pages | Issue A | From $799 USD

Chlorine Production from Sodium Chloride (Membrane Process)
This study presents the economics of Chlorine production from sodium chloride via a membrane process plant located in the United States. In the process under analysis, an aqueous solution of sodium chloride (brine) is decomposed electrolytically in a membrane cell, producing Chlorine, sodium hydroxide and hydrogen.
Details: 500 kta United States-based plant | Q1 2026 | 107 pages | Issue A | From $799 USD

Allyl Polyethylene Glycol Production
This report presents the economics of Allyl Polyethylene Glycol (PEG) production in the United States. The analysis assumes an industrial plant that generates Allyl PEG starting from PEG and allyl chloride. In this batchwise process, methoxy polyethylene glycol ether (MPEG) reacts with allyl chloride to generate an allyl-terminated polyethylene glycol methyl ether (Allyl PEG).
Details: 11 kta United States-based plant | Q1 2026 | 107 pages | Issue A | From $1,999 USD

Epichlorohydrin Production from Allyl Chloride
This report presents a economic analysis of Epichlorohydrin production from allyl chloride and chlorine in the United States using a typical hypochlorination process. Initially, allyl chloride is reacted with hypochlorous acid, formed by chlorine dispersion in water. The glycerol dichlorohydrins generated are then treated with calcium hydroxide to promote epoxidation, yielding ECH.
Details: 75 kta United States-based plant | Q1 2026 | 107 pages | Issue A | From $799 USD
+800 Reports Developed, Targeting +250 Commodities
Vast Report Library
858 independent and up-to-date reports examining embryonic and established production processes.
Free Sample Reports
Quickly understand the structure and depth of content of our professional reports.